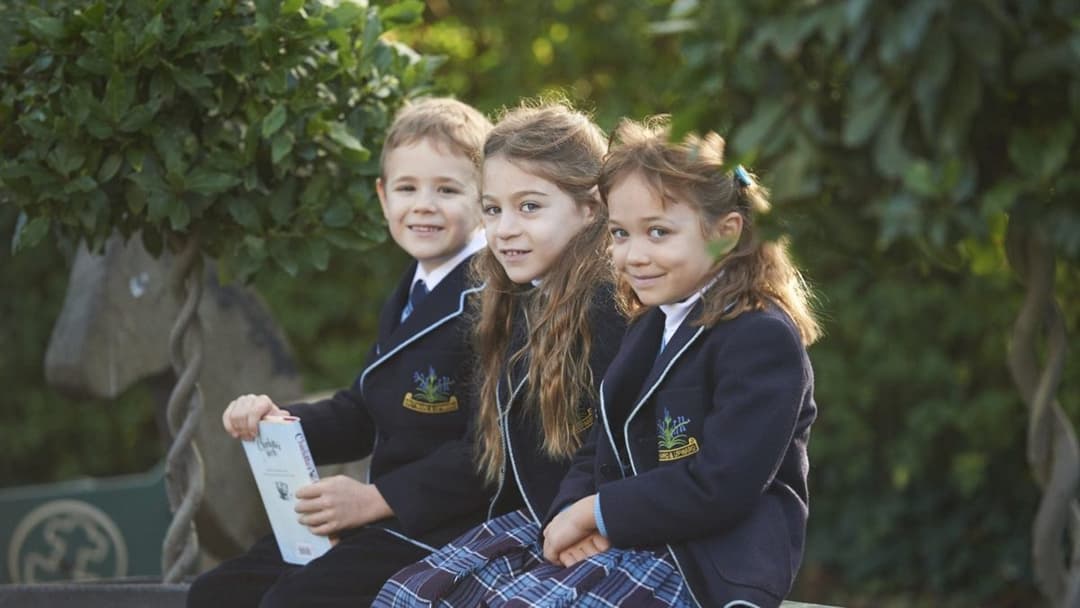
Annemount School
Ages 2 to 7 · boys and girls
There are 127 open schools in London: 67 primary schools, 20 secondary schools, 2 all-through schools, 2 nursery schools and 2 sixth form colleges. 26 are independent and 100 are state-funded, including 6 state special schools. Admissions for state schools in London are run by Barnet.
Ofsted stopped single-word grades in September 2024. Of the other schools, 18 have a new-style report card instead; 6 had a graded inspection with no overall grade; 13 independent schools are inspected by ISI.
Ages 2 to 7 · boys and girls
Ages 5 to 11 · girls
Ages 11 to 16 · boys
Ages 11 to 17 · girls

Ages 15 to 19 · boys and girls
Ages 2 to 18 · boys and girls
Ages 2 to 6 · boys and girls
Ages 3 to 11 · boys and girls
In the 2025 Year 6 tests, 48 of the 62 primary schools in London with published results had a bigger share of pupils reaching the expected standard in reading, writing and maths than the England average of 62%. Across London, 72% of Year 6 pupils reached it.
One dot per school; hover or tap a dot for its name.
| School | Value |
|---|---|
| Courtland School | 97% |
| Deansbrook Junior School | 95% |
| Brunswick Park Primary and Nursery School | 93% |
| St Andrew's CofE Voluntary Aided Primary School, Totteridge | 93% |
| Menorah Primary School for Boys | 91% |
| Hasmonean Primary School | 90% |
| Menorah Primary School for Girls | 90% |
| Etz Chaim Jewish Primary School | 88% |
| Monkfrith Primary School | 88% |
| St John's CofE Primary and Nursery School | 87% |
| St Paul's CofE Primary School NW7 | 87% |
| Akiva School | 86% |
| Chalgrove Primary School | 86% |
| Independent Jewish Day School | 83% |
| Sacred Heart Roman Catholic Primary School | 83% |
| Brookland Junior School | 82% |
| St Agnes' Catholic Primary School | 82% |
| St Mary's CofE Primary School | 82% |
| Moss Hall Junior School | 81% |
| Ashmole Primary School | 80% |
| Rimon Jewish Primary School | 80% |
| Sunnyfields Primary School | 80% |
| Wren Academy Finchley | 80% |
| Woodridge Primary School | 79% |
| Alma Primary | 78% |
| All Saints' CofE Nursery and Primary School N20 | 77% |
| Sacks Morasha Jewish Primary School | 77% |
| The Orion Primary School | 77% |
| Holy Trinity CofE Primary School | 76% |
| The Hyde School | 76% |
| Garden Suburb Junior School | 75% |
| Beis Yaakov Primary School | 74% |
| Manorside Primary School | 73% |
| Martin Primary School | 73% |
| Hollickwood Primary School | 72% |
| Mathilda Marks-Kennedy Jewish Primary School | 70% |
| St Theresa's Catholic Primary School | 69% |
| Summerside Primary Academy | 69% |
| Blessed Dominic Catholic Primary School | 68% |
| Fairway Primary School and Children's Centre | 68% |
| Frith Manor Primary School | 68% |
| St Joseph's Catholic Primary School | 68% |
| Our Lady of Lourdes RC School | 66% |
| Tudor Primary School | 64% |
| Queenswell Junior School | 63% |
| St John's CofE Junior Mixed and Infant School | 63% |
| St Paul's CofE Primary School N11 | 63% |
| Wessex Gardens Primary School | 63% |
| Pardes House Primary School | 62% |
| Colindale Primary School | 60% |
| Dollis Primary School | 60% |
| Osidge Primary School | 58% |
| Northside Primary School | 57% |
| Childs Hill Primary School | 56% |
| St Vincent's Catholic Primary School | 56% |
| All Saints' CofE Primary School NW2 | 55% |
| Parkfield Primary School | 51% |
| Holly Park Primary School | 49% |
| Claremont Primary School | 48% |
| Millbrook Park Primary School | 44% |
| Coppetts Wood Primary School | 43% |
| Saracens Bell Lane | 39% |
Highest share reaching the expected standard: Courtland School (97%), Deansbrook Junior School (95%) and Brunswick Park Primary and Nursery School (93%).
At GCSE in 2026 (provisional figures), 20 of the 22 secondary schools in London with published results scored above the England average Attainment 8 of 46.2, an average of about grade 4.6 across eight subjects. The average across London's schools was 56.6.
One dot per school; hover or tap a dot for its name.
| School | Value |
|---|---|
| The Henrietta Barnett School | 87.1 |
| St Michael's Catholic Grammar School | 78.1 |
| Wren Academy Finchley | 65.1 |
| Menorah High School for Girls | 62.5 |
| The Archer Academy | 61.6 |
| Ashmole Academy | 61.1 |
| The Totteridge Academy | 60.9 |
| Mill Hill County High School | 60.8 |
| Hasmonean High School for Girls | 60.6 |
| Hasmonean High School for Boys | 60.0 |
| Finchley Catholic High School | 59.5 |
| Christ's College Finchley | 56.4 |
| The Compton School | 55.5 |
| St Mary's and St John's CofE School | 54.5 |
| St James' Catholic High School | 50.4 |
| St Andrew the Apostle Greek Orthodox School | 49.5 |
| Bishop Douglass School Finchley | 47.3 |
| Saracens High School | 47.1 |
| Copthall School | 47.0 |
| Hendon School | 46.6 |
| Clarion | 43.4 |
| Friern Barnet School | 41.5 |
Highest Attainment 8: The Henrietta Barnett School (87.1), St Michael's Catholic Grammar School (78.1) and Wren Academy Finchley (65.1).
Independent schools' GCSE results are not published in these tables, so the 12 independent secondary schools here are not included.
Source: Department for Education performance data. Schools with fewer than 11 pupils taking the tests are left out of the highest list, because a few pupils swing the figures.
For state schools you apply through your home council, which for families living in London is Barnet council, even if the school you want is in another council area. You list your preferences on one form, and the council makes one offer.
More: school admissions on GOV.UK.