
Bournemouth Collegiate School
Ages 11 to 19 · boys and girls
There are 49 open schools in Bournemouth: 29 primary schools, 10 secondary schools and 2 all-through schools. 5 are independent and 43 are state-funded, including 2 state special schools. Admissions for state schools in Bournemouth are run by Bournemouth, Christchurch and Poole.
Ofsted stopped single-word grades in September 2024. Of the other schools, 2 have a new-style report card instead; 10 had a graded inspection with no overall grade; 5 independent schools are inspected by ISI.
Ages 11 to 19 · boys and girls
Ages 14 to 25 · boys and girls
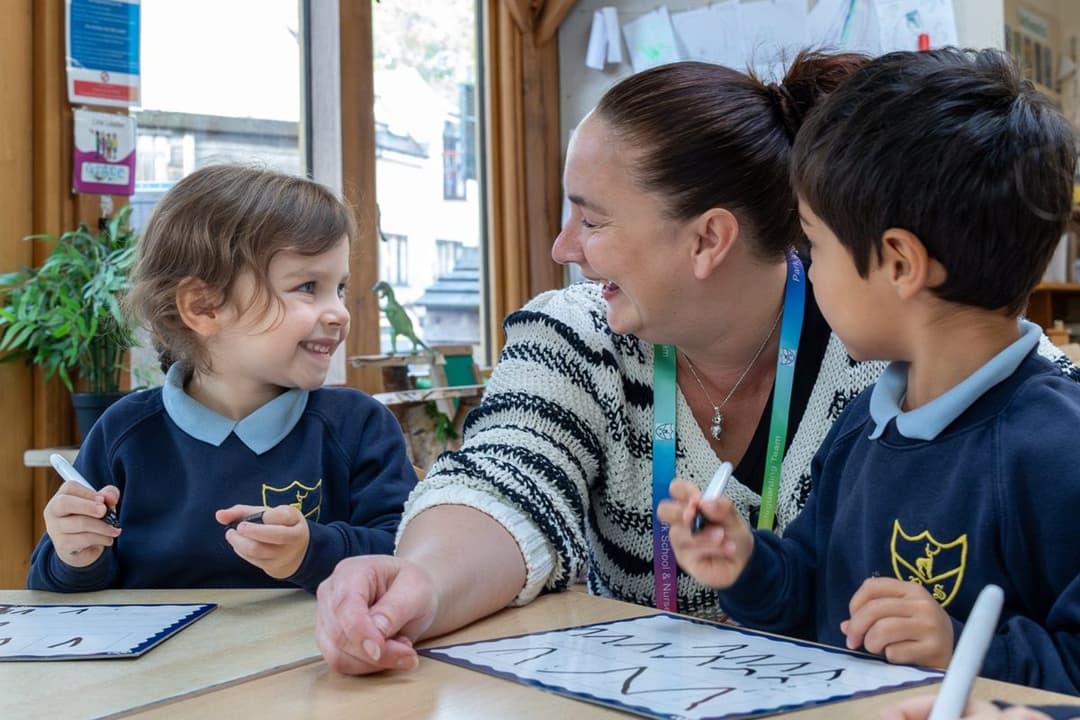
Ages 0 to 11 · boys and girls
Ages 3 to 11 · boys and girls
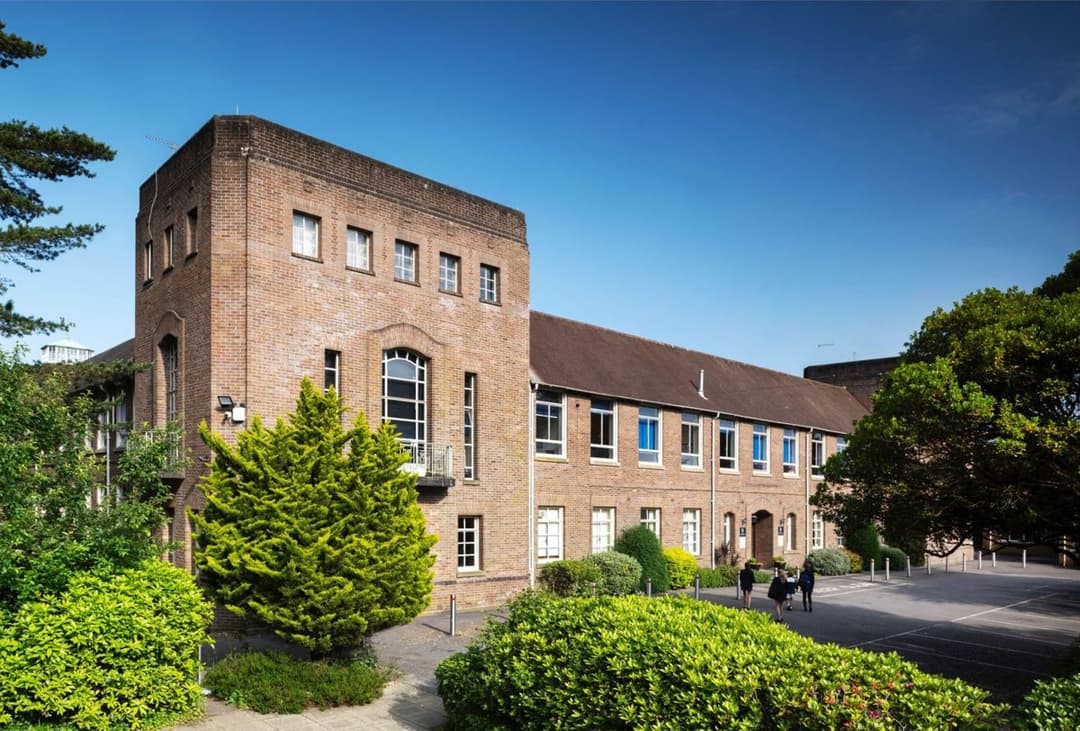
Ages 2 to 19 · boys and girls
In the 2025 Year 6 tests, 17 of the 27 primary schools in Bournemouth with published results had a bigger share of pupils reaching the expected standard in reading, writing and maths than the England average of 62%. Across Bournemouth, 66% of Year 6 pupils reached it.
One dot per school; hover or tap a dot for its name.
| School | Value |
|---|---|
| St. Walburga's Catholic Primary School | 98% |
| Winton Primary School | 88% |
| Moordown St John's Church of England Primary School | 85% |
| Avonwood Primary School | 84% |
| St Katharine's Church of England Primary School | 78% |
| Elm Primary Academy | 77% |
| The Epiphany School | 77% |
| Queen's Park Academy | 75% |
| Stourfield Junior School | 73% |
| Muscliff Primary School | 70% |
| St James' Church of England Primary Academy | 68% |
| St Peter's Catholic Comprehensive School | 68% |
| Corpus Christi Catholic Primary School | 67% |
| St Luke's Church of England Primary School | 67% |
| St Michael's Church of England Primary School | 67% |
| Kinson Academy | 65% |
| St Mark's Church of England Primary School | 63% |
| Kingsleigh Primary School | 58% |
| Pokesdown Community Primary School | 58% |
| Jewell Academy Bournemouth | 57% |
| King's Park Academy | 56% |
| Hill View Primary Academy | 54% |
| Malmesbury Park Primary School | 51% |
| Bearwood Primary and Nursery School | 46% |
| Heathlands Primary Academy | 38% |
| Bethany Church of England Junior School | 35% |
| Christ The King Catholic Primary School | 15% |
Highest share reaching the expected standard: St. Walburga's Catholic Primary School (98%), Winton Primary School (88%) and Moordown St John's Church of England Primary School (85%).
At GCSE in 2026 (provisional figures), 7 of the 12 secondary schools in Bournemouth with published results scored above the England average Attainment 8 of 46.2, an average of about grade 4.6 across eight subjects. The average across Bournemouth's schools was 53.0.
One dot per school; hover or tap a dot for its name.
| School | Value |
|---|---|
| Bournemouth School for Girls | 72.0 |
| Bournemouth School | 71.2 |
| Glenmoor Academy | 59.3 |
| Winton Academy | 56.1 |
| Avonbourne Girls Academy | 54.0 |
| St Peter's Catholic Comprehensive School | 49.2 |
| Avonbourne Boys' Academy | 47.4 |
| The Bourne Academy | 46.2 |
| The Bishop of Winchester Academy | 45.1 |
| Livingstone Academy Bournemouth | 44.0 |
| LEAF Studio | 36.1 |
| Oak Academy | 34.0 |
Highest Attainment 8: Bournemouth School for Girls (72.0), Bournemouth School (71.2) and Glenmoor Academy (59.3).
Independent schools' GCSE results are not published in these tables, so the 3 independent secondary schools here are not included.
Source: Department for Education performance data. Schools with fewer than 11 pupils taking the tests are left out of the highest list, because a few pupils swing the figures.
For state schools you apply through your home council, which for families living in Bournemouth is Bournemouth, Christchurch and Poole council, even if the school you want is in another council area. You list your preferences on one form, and the council makes one offer.
More: school admissions on GOV.UK.