
Brighton College
Ages 11 to 19 · boys and girls
There are 59 open schools in Brighton: 36 primary schools, 6 secondary schools, 2 nursery schools and 1 sixth form college. 8 are independent and 47 are state-funded, including 2 state special schools. Admissions for state schools in Brighton are run by Brighton and Hove.
Ages 11 to 19 · boys and girls
Ages 3 to 12 · boys and girls
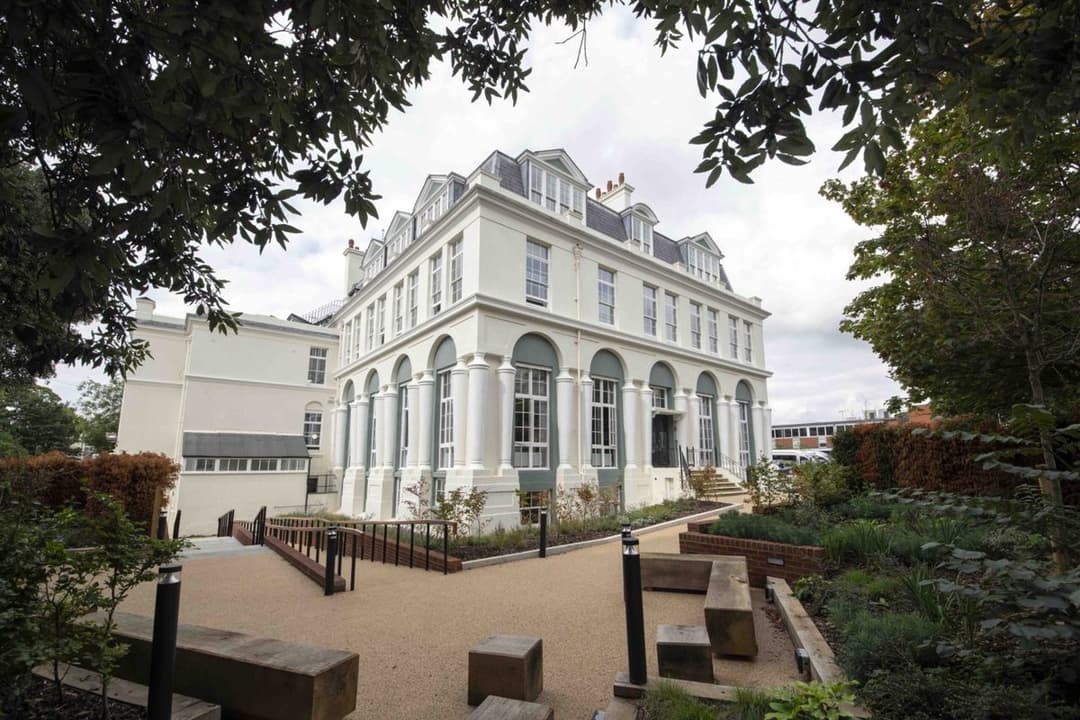
Ages 3 to 16 · girls
Ages 5 to 19 · boys and girls
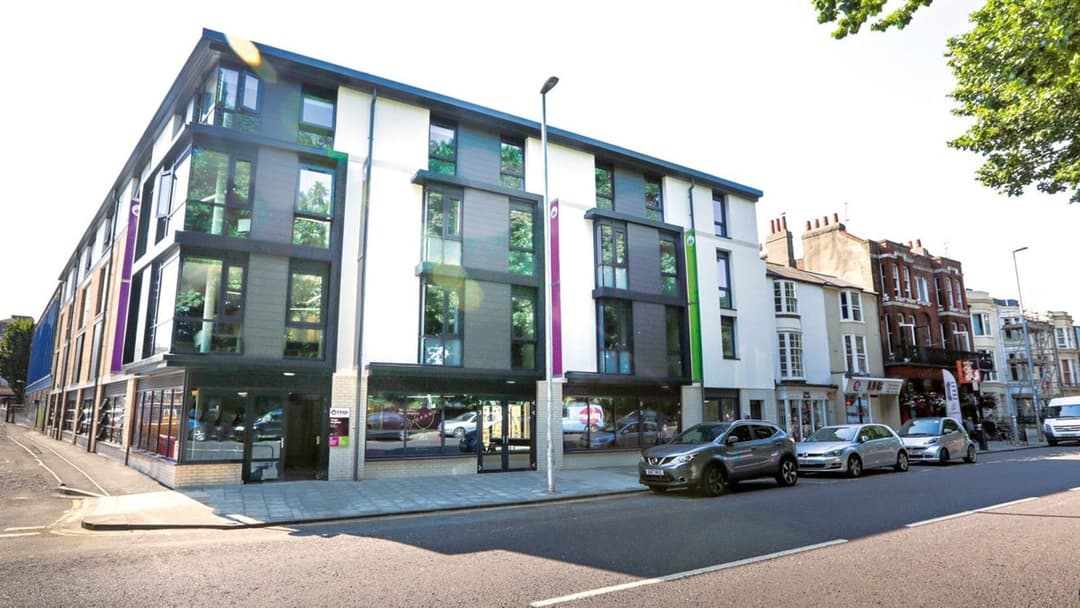
Ages 14 to 19 · boys and girls
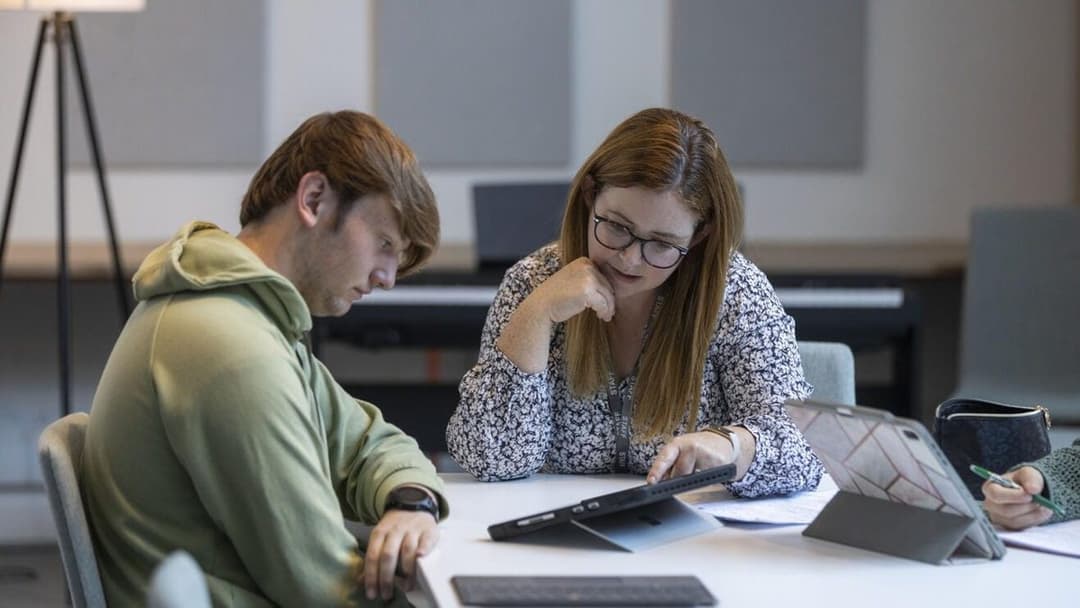
Ages 13 to 19 · boys and girls
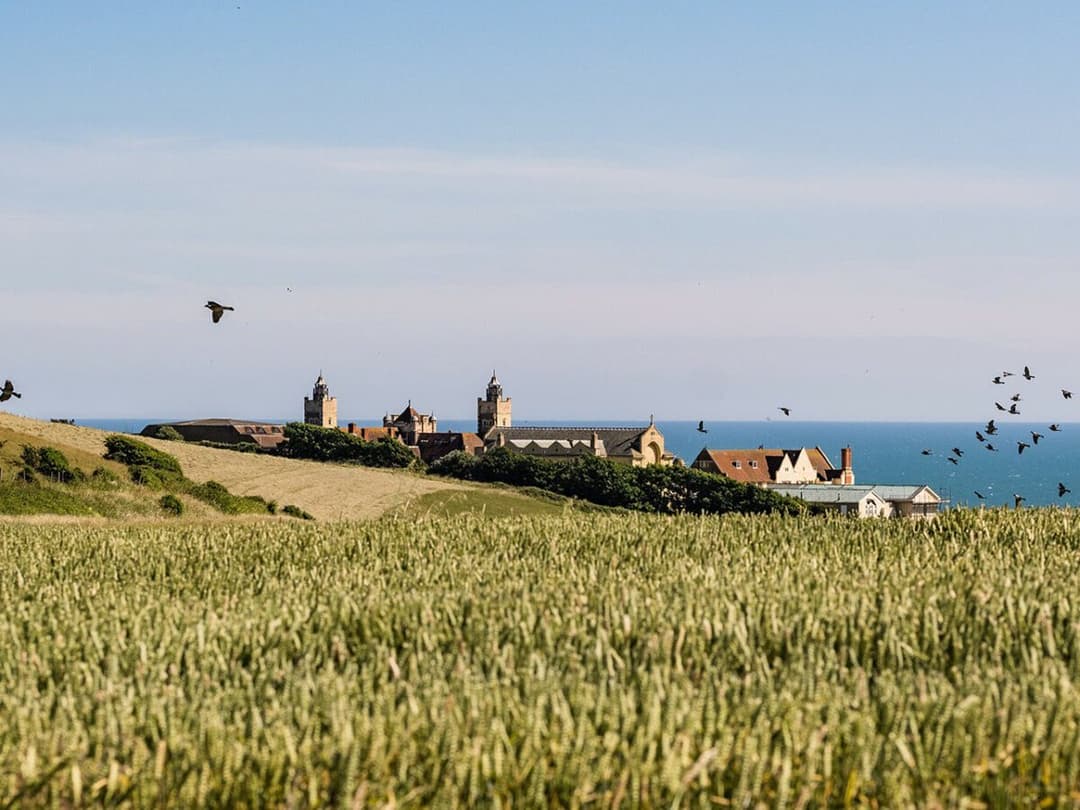
Ages 11 to 18 · girls
Ages 2 to 11 · boys and girls
In the 2025 Year 6 tests, 9 of the 31 primary schools in Brighton with published results had a bigger share of pupils reaching the expected standard in reading, writing and maths than the England average of 62%. Across Brighton, 57% of Year 6 pupils reached it.
One dot per school; hover or tap a dot for its name.
| School | Value |
|---|---|
| Peter Gladwin Primary School | 77% |
| St Paul's CofE Primary School | 76% |
| Carlton Hill Primary School | 74% |
| Patcham Junior School | 72% |
| Balfour Primary School | 71% |
| Bevendean Primary School and Nursery | 69% |
| St Bernadette's Catholic Primary School | 66% |
| St Margaret's CofE Primary School, Rottingdean | 65% |
| St Mary's Catholic Primary School | 63% |
| St Mary Magdalen Catholic Primary School | 61% |
| Downs Junior School | 60% |
| St Luke's Primary School | 60% |
| St Martin's CofE Primary School | 60% |
| St Nicolas CofE Primary School | 59% |
| Westdene Primary School | 59% |
| Mile Oak Primary School | 58% |
| City Academy Whitehawk | 57% |
| Brackenbury Primary School | 55% |
| Saltdean Primary School | 52% |
| Fairlight Primary School | 51% |
| Benfield Primary School | 50% |
| Carden Nursery and Primary School | 50% |
| Our Lady of Lourdes RC School | 48% |
| Coldean Primary School | 46% |
| Moulsecoomb Primary School | 46% |
| Rudyard Kipling Primary School & Nursery | 46% |
| Hertford Primary School | 44% |
| St John the Baptist Catholic Primary School | 40% |
| Elm Grove Primary School | 39% |
| St Mark's CofE Primary School | 33% |
| Queen's Park Primary School | 30% |
Highest share reaching the expected standard: Peter Gladwin Primary School (77%), St Paul's CofE Primary School (76%) and Carlton Hill Primary School (74%).
At GCSE in 2026 (provisional figures), 3 of the 6 secondary schools in Brighton with published results scored above the England average Attainment 8 of 46.2, an average of about grade 4.6 across eight subjects. The average across Brighton's schools was 46.4.
One dot per school; hover or tap a dot for its name.
| School | Value |
|---|---|
| Varndean School | 54.7 |
| Dorothy Stringer School | 50.5 |
| Patcham High School | 46.7 |
| Portslade Aldridge Community Academy | 44.1 |
| Longhill High School | 36.3 |
| Brighton Aldridge Community Academy | 33.2 |
Highest Attainment 8: Varndean School (54.7), Dorothy Stringer School (50.5) and Patcham High School (46.7).
Independent schools' GCSE results are not published in these tables, so the 5 independent secondary schools here are not included.
Source: Department for Education performance data. Schools with fewer than 11 pupils taking the tests are left out of the highest list, because a few pupils swing the figures.
For state schools you apply through your home council, which for families living in Brighton is Brighton and Hove council, even if the school you want is in another council area. You list your preferences on one form, and the council makes one offer.
More: school admissions on GOV.UK.