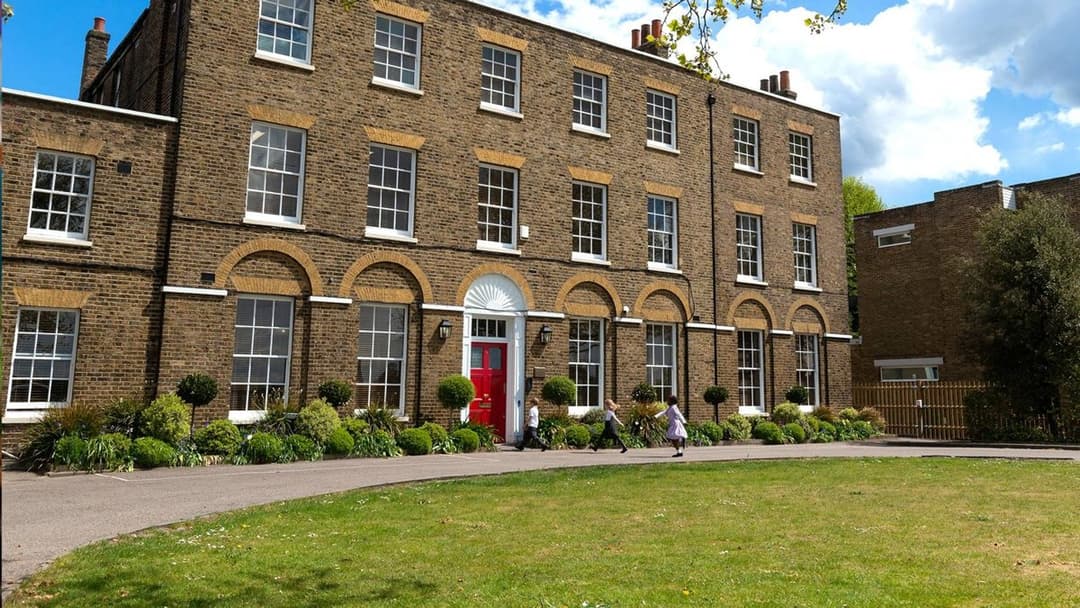
Blackheath Prep
Ages 3 to 11 · boys and girls
There are 99 open schools in London: 61 primary schools, 14 secondary schools, 1 all-through school, 4 nursery schools and 1 sixth form college. 13 are independent and 86 are state-funded, including 4 state special schools. Admissions for state schools in London are run by Greenwich.
Ofsted stopped single-word grades in September 2024. Of the other schools, 13 have a new-style report card instead; 10 had a graded inspection with no overall grade; 7 independent schools are inspected by ISI.
Ages 3 to 11 · boys and girls
Ages 3 to 19 · boys and girls
Ages 3 to 18 · boys and girls
Ages 11 to 16 · boys and girls
Ages 1 to 21 · boys and girls
Ages 4 to 18 · boys and girls

Ages 11 to 19 · boys and girls
Ages 3 to 11 · boys and girls
In the 2025 Year 6 tests, 54 of the 61 primary schools in London with published results had a bigger share of pupils reaching the expected standard in reading, writing and maths than the England average of 62%. Across London, 73% of Year 6 pupils reached it.
One dot per school; hover or tap a dot for its name.
| School | Value |
|---|---|
| Deansfield Primary School | 91% |
| St Patrick's Catholic Primary School | 88% |
| Alderwood Primary School | 87% |
| Our Lady of Grace Catholic Primary School | 87% |
| Wingfield Primary School | 85% |
| Sherington Primary School | 84% |
| Eltham Church of England Primary School | 83% |
| Morden Mount Primary School | 83% |
| Nightingale Primary School | 83% |
| St Mary's Catholic Primary School | 83% |
| Gordon Primary School | 82% |
| Meridian Primary School | 82% |
| Foxfield Primary School | 81% |
| Rockliffe Manor Primary School | 81% |
| Cherry Orchard Primary School | 80% |
| Fossdene Primary School | 80% |
| Horn Park Primary School | 80% |
| James Wolfe Primary School and Centre for the Deaf | 80% |
| Timbercroft Primary School | 80% |
| Cardwell Primary School | 79% |
| Plumcroft Primary School | 79% |
| South Rise Primary School | 78% |
| Ealdham Primary School | 77% |
| Henwick Primary School | 77% |
| Heronsgate Primary School | 77% |
| Millennium Primary School | 77% |
| De Lucy Primary School | 76% |
| Greenslade Primary School | 75% |
| Halstow Primary School | 75% |
| Kidbrooke Park Primary School | 75% |
| St Margaret Clitherow Catholic Primary School | 75% |
| St Thomas A Becket Roman Catholic Primary School | 75% |
| Hawksmoor School | 74% |
| Mulgrave Primary School | 74% |
| Bannockburn Primary School | 73% |
| Christ Church Church of England Primary School, Shooters Hill | 73% |
| Conway Primary School | 73% |
| St Peter's Catholic Primary School | 73% |
| Thorntree Primary School | 73% |
| Wyborne Primary School | 73% |
| Alexander McLeod Primary School | 72% |
| Haimo Primary School | 72% |
| Eglinton Primary School | 69% |
| St Thomas More Catholic Primary School | 69% |
| Middle Park Primary School | 68% |
| St Joseph's Catholic Primary School | 68% |
| Bishop John Robinson Church of England Primary School | 67% |
| St Margaret's Church of England Primary School | 67% |
| Christ Church Church of England Primary School | 65% |
| Montbelle Primary School | 65% |
| Windrush Charlton Primary School | 65% |
| Linton Mead Primary School | 63% |
| St Alfege with St Peter's Church of England Primary School | 63% |
| Woodhill Primary School | 63% |
| Brooklands Primary School | 61% |
| Invicta Primary School | 61% |
| Discovery Primary School | 59% |
| Windrush Thamesmead Primary School | 57% |
| Greenacres Primary School and Language Impairment Unit | 56% |
| Charlton Manor Primary School | 48% |
| Saint Mary Magdalene Church of England All Through School | 47% |
Highest share reaching the expected standard: Deansfield Primary School (91%), St Patrick's Catholic Primary School (88%) and Alderwood Primary School (87%).
At GCSE in 2026 (provisional figures), 9 of the 15 secondary schools in London with published results scored above the England average Attainment 8 of 46.2, an average of about grade 4.6 across eight subjects. The average across London's schools was 48.2.
One dot per school; hover or tap a dot for its name.
| School | Value |
|---|---|
| Ark Greenwich Free School | 65.8 |
| St Thomas More Catholic Comprehensive School | 59.6 |
| St Ursula's Convent School | 54.0 |
| Leigh Academy Blackheath | 53.7 |
| Leigh Stationers' Academy | 53.1 |
| Eltham Hill School | 52.6 |
| Harris Academy Greenwich | 49.8 |
| Thomas Tallis School | 47.4 |
| The John Roan School | 46.3 |
| Woolwich Polytechnic School | 45.2 |
| Leigh Academy Halley | 44.3 |
| Saint Mary Magdalene Church of England All Through School | 43.2 |
| St Paul's Academy | 42.1 |
| Plumstead Manor School | 41.0 |
| Royal Greenwich Trust School | 38.8 |
Highest Attainment 8: Ark Greenwich Free School (65.8), St Thomas More Catholic Comprehensive School (59.6) and St Ursula's Convent School (54.0).
Independent schools' GCSE results are not published in these tables, so the 4 independent secondary schools here are not included.
Source: Department for Education performance data. Schools with fewer than 11 pupils taking the tests are left out of the highest list, because a few pupils swing the figures.
For state schools you apply through your home council, which for families living in London is Greenwich council, even if the school you want is in another council area. You list your preferences on one form, and the council makes one offer.
More: school admissions on GOV.UK.