
Footsteps Trust
Ages 12 to 16 · boys and girls
There are 92 open schools in London: 59 primary schools, 11 secondary schools, 1 all-through school, 3 nursery schools and 2 sixth form colleges. 7 are independent and 82 are state-funded, including 5 state special schools. Admissions for state schools in London are run by Haringey.
Ofsted stopped single-word grades in September 2024. Of the other schools, 15 have a new-style report card instead; 9 had a graded inspection with no overall grade; 2 independent schools are inspected by ISI.
Ages 12 to 16 · boys and girls

Ages 12 to 18 · boys and girls
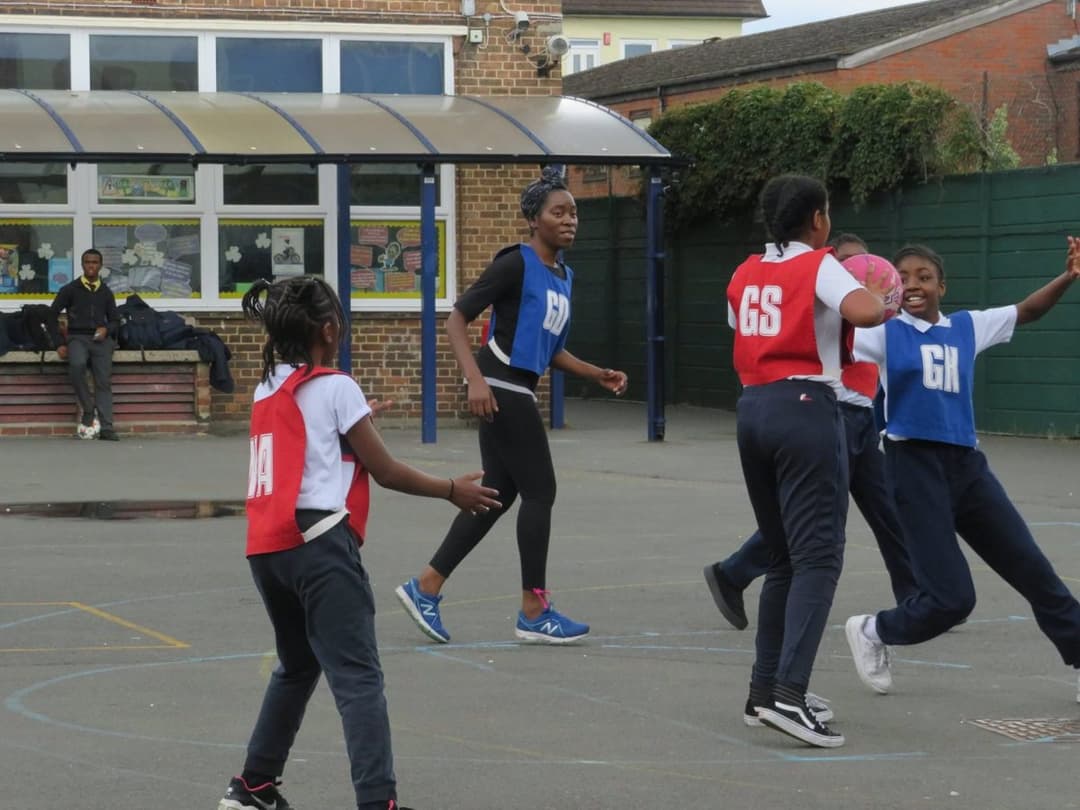
Ages 2 to 11 · boys and girls
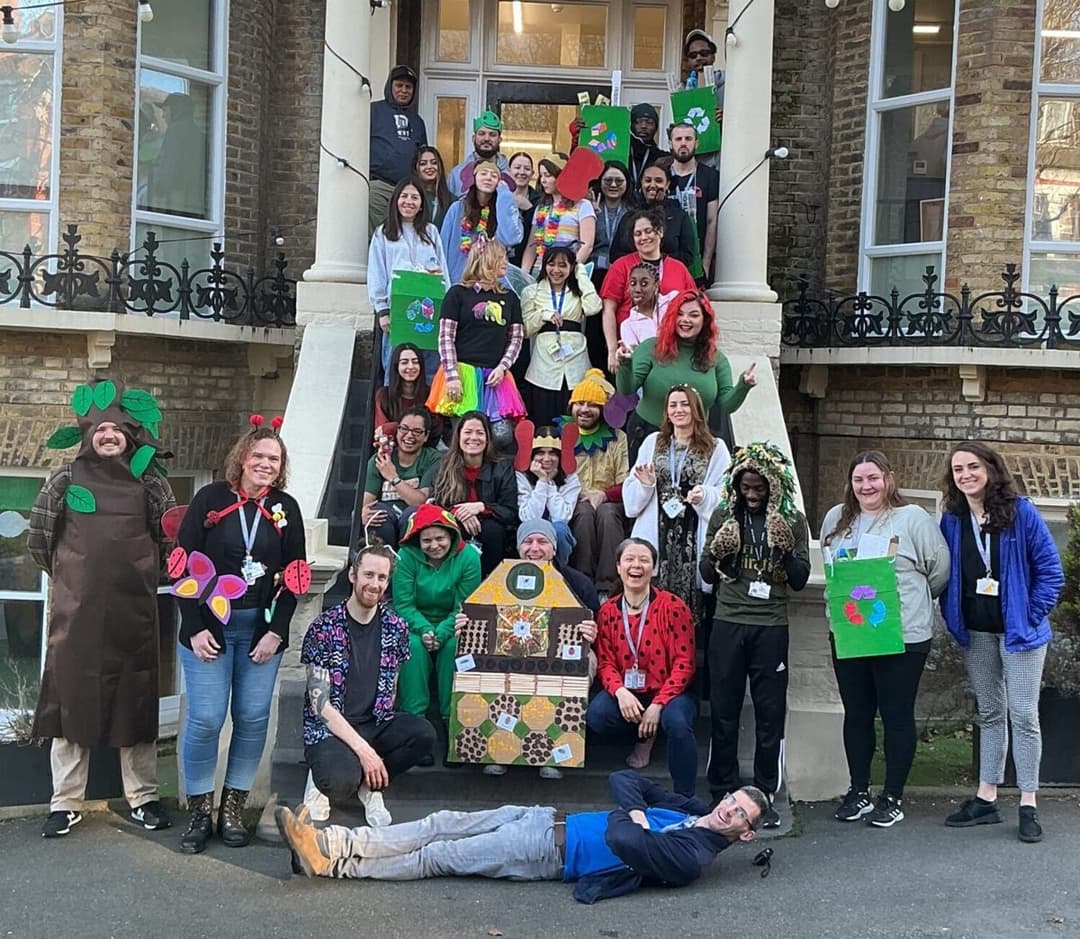
Ages 5 to 16 · boys and girls
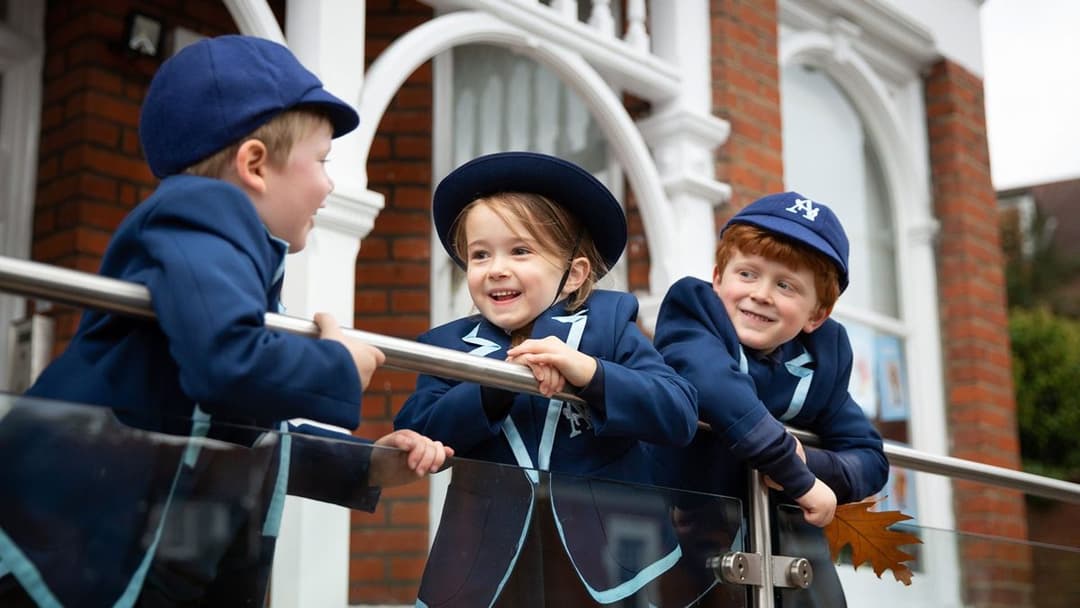
Ages 2 to 8 · boys and girls

Ages 3 to 19 · boys and girls
Ages 11 to 18 · boys and girls
In the 2025 Year 6 tests, 36 of the 49 primary schools in London with published results had a bigger share of pupils reaching the expected standard in reading, writing and maths than the England average of 62%. Across London, 73% of Year 6 pupils reached it.
One dot per school; hover or tap a dot for its name.
| School | Value |
|---|---|
| Lift Trinity | 98% |
| Eden Primary | 93% |
| Holy Trinity CofE Primary School | 92% |
| Lift Noel Park | 92% |
| Rhodes Avenue Primary School | 92% |
| Harris Academy Tottenham | 89% |
| St Michael's CofE Primary School | 89% |
| St James Church of England Primary School | 87% |
| Muswell Hill Primary School | 85% |
| Coldfall Primary School | 84% |
| Harris Primary Academy Philip Lane | 83% |
| St Martin of Porres Catholic Primary School | 83% |
| Our Lady of Muswell Catholic Primary School | 82% |
| North Harringay Primary School | 81% |
| Rokesly Junior School | 81% |
| Stroud Green Primary School | 81% |
| Highgate Primary School | 80% |
| St Michael's CofE Voluntary Aided Primary School | 80% |
| South Harringay Junior School | 78% |
| St John Vianney RC Primary School | 77% |
| Campsbourne Junior School | 76% |
| Weston Park Primary School | 75% |
| Earlham Primary School | 74% |
| Earlsmead Primary School | 74% |
| Harris Primary Academy Coleraine Park | 74% |
| Tetherdown Primary School | 73% |
| The Devonshire Hill Nursery & Primary School | 73% |
| West Green Primary School | 71% |
| Chestnuts Primary School | 70% |
| Coleridge Primary School | 70% |
| St Paul's Catholic Primary School | 70% |
| Brook House Primary School | 69% |
| Belmont Junior School | 65% |
| Lancasterian Primary School | 64% |
| Risley Avenue Primary School | 63% |
| Welbourne Primary School | 63% |
| Bruce Grove Primary School | 62% |
| Ferry Lane Primary School | 62% |
| The Willow Primary School | 62% |
| South Grove Primary School | 61% |
| St Mary's CofE Primary School | 61% |
| St Paul's and All Hallows CofE Junior School | 61% |
| St Ann's CE Primary School | 56% |
| The Mulberry Primary School | 56% |
| Bounds Green Junior School | 55% |
| St Aidan's Voluntary Controlled Primary School | 54% |
| Lea Valley Primary School | 53% |
| Alexandra Primary School | 50% |
| Crowland Primary School | 41% |
Highest share reaching the expected standard: Lift Trinity (98%), Eden Primary (93%) and Holy Trinity CofE Primary School (92%).
At GCSE in 2026 (provisional figures), 8 of the 12 secondary schools in London with published results scored above the England average Attainment 8 of 46.2, an average of about grade 4.6 across eight subjects. The average across London's schools was 49.8.
One dot per school; hover or tap a dot for its name.
| School | Value |
|---|---|
| Alexandra Park School | 61.9 |
| Fortismere School | 60.9 |
| Highgate Wood Secondary School | 53.1 |
| St Thomas More Catholic School | 52.9 |
| Heartlands High School | 50.5 |
| Harris Academy Tottenham | 49.0 |
| Hornsey School for Girls | 47.9 |
| Gladesmore Community School | 46.5 |
| Mulberry Academy Woodside | 45.4 |
| Greig City Academy | 44.6 |
| Park View School | 42.1 |
| Duke's Aldridge | 36.3 |
Highest Attainment 8: Alexandra Park School (61.9), Fortismere School (60.9) and Highgate Wood Secondary School (53.1).
Independent schools' GCSE results are not published in these tables, so the 3 independent secondary schools here are not included.
Source: Department for Education performance data. Schools with fewer than 11 pupils taking the tests are left out of the highest list, because a few pupils swing the figures.
For state schools you apply through your home council, which for families living in London is Haringey council, even if the school you want is in another council area. You list your preferences on one form, and the council makes one offer.
More: school admissions on GOV.UK.