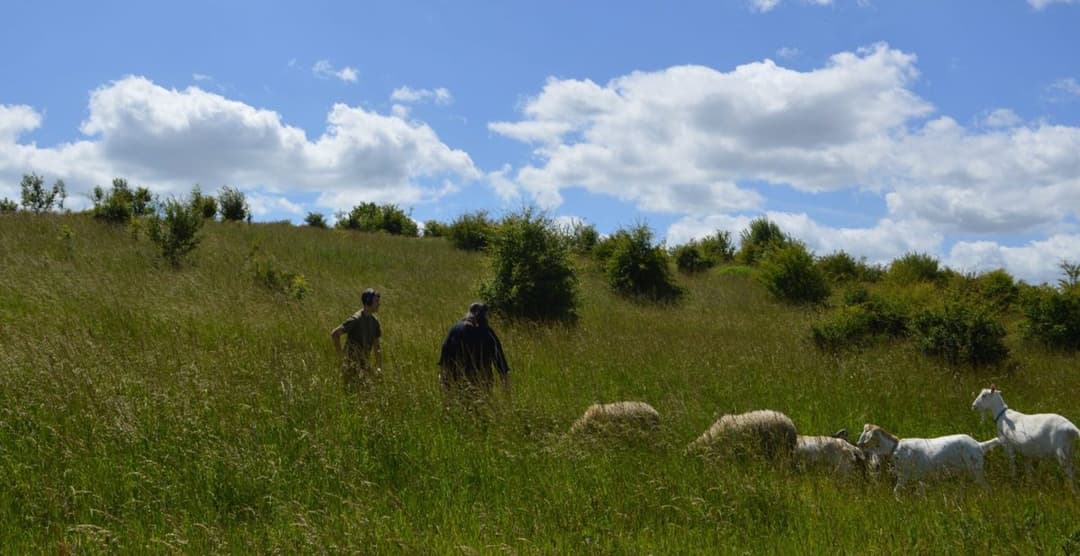
Haven Nook
Ages 11 to 18 · boys and girls
There are 52 open schools in Canterbury: 30 primary schools and 8 secondary schools. 11 are independent and 40 are state-funded, including 2 state special schools. Admissions for state schools in Canterbury are run by Kent.
Ages 11 to 18 · boys and girls
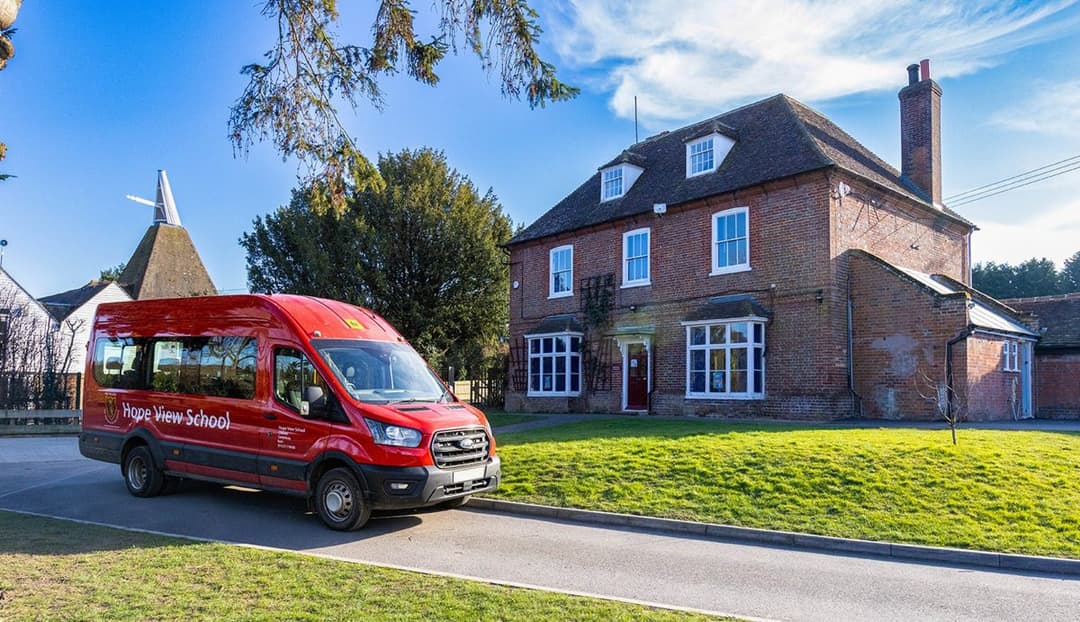
Ages 7 to 18 · boys
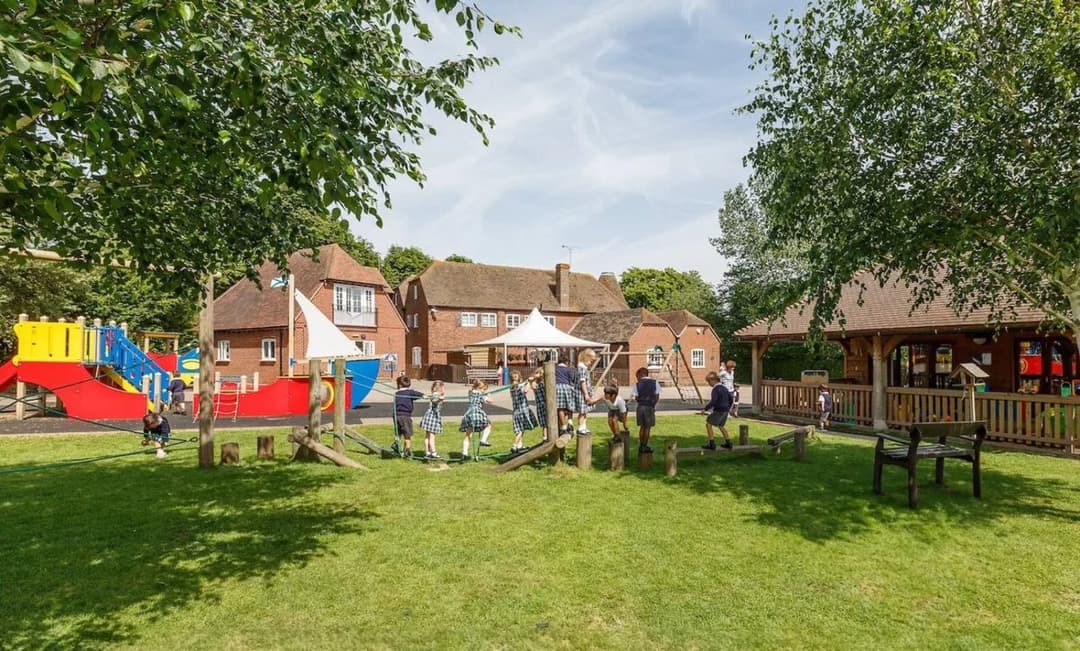
Ages 2 to 14 · boys and girls
Ages 11 to 19 · boys and girls
Ages 11 to 18 · boys and girls
Ages 2 to 11 · boys and girls
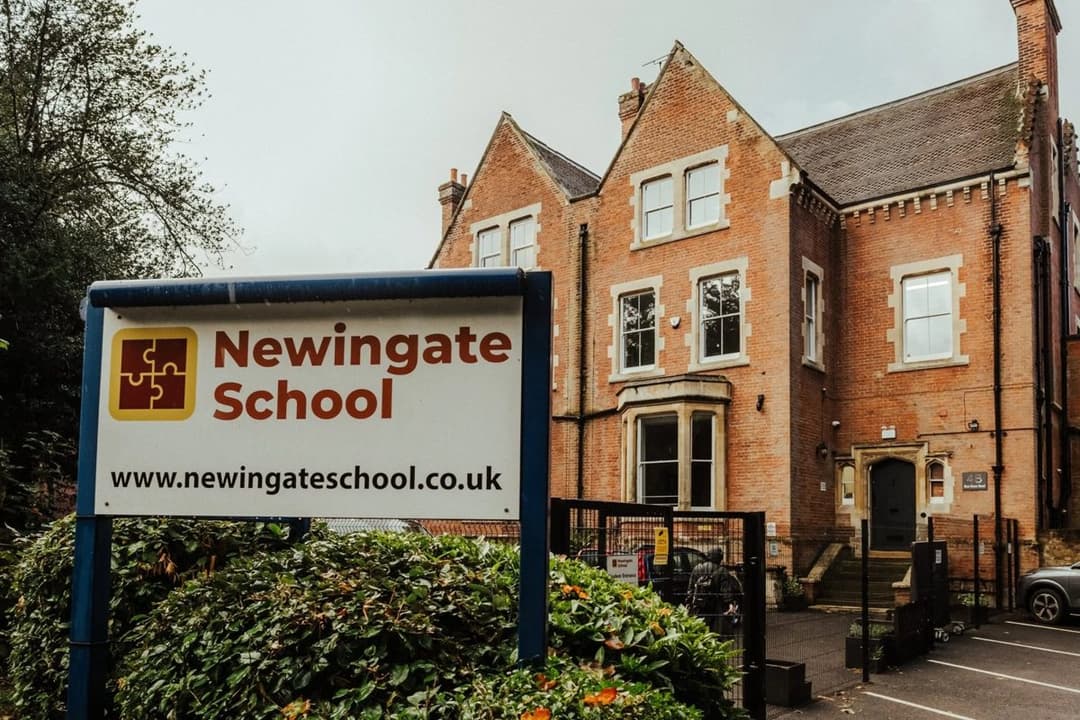
Ages 11 to 18 · boys and girls
Ages 3 to 19 · boys and girls
In the 2025 Year 6 tests, 15 of the 27 primary schools in Canterbury with published results had a bigger share of pupils reaching the expected standard in reading, writing and maths than the England average of 62%. Across Canterbury, 60% of Year 6 pupils reached it.
One dot per school; hover or tap a dot for its name. Paler dots: fewer than 11 pupils took part.
| School | Value |
|---|---|
| Blean Primary School | 80% |
| St Thomas' Catholic Primary School, Canterbury | 80% |
| Sturry Church of England Primary School | 78% |
| Wingham Primary School | 77% |
| Adisham Church of England Primary School | 75% |
| Bridge and Patrixbourne Church of England Primary School | 74% |
| Hoath Primary School | 71% |
| Stelling Minnis Church of England Primary School | 71% (fewer than 11 pupils) |
| St Joseph's Catholic Primary School, Aylesham | 71% |
| Water Meadows Primary School | 71% |
| Petham Primary School | 67% |
| Wincheap Foundation Primary School | 66% |
| Chartham Primary School | 63% |
| Preston Primary School | 63% |
| St Peter's Methodist Primary School | 63% |
| Elham Church of England Primary School | 60% |
| Barham Church of England Primary School | 58% |
| Ash Cartwright and Kelsey Church of England Primary School | 54% |
| The Canterbury Primary School | 51% |
| Chislet Church of England Primary School | 47% |
| Littlebourne Church of England Primary School | 47% |
| Chilham, St Mary's Church of England Primary School | 46% |
| Pilgrims' Way Primary School | 44% |
| St Stephen's Junior School | 44% |
| St Johns Church of England Primary School | 38% |
| Goodnestone Church of England Primary School | 33% (fewer than 11 pupils) |
| Parkside Community Foundation Primary School | 23% |
Highest share reaching the expected standard: Blean Primary School (80%), St Thomas' Catholic Primary School, Canterbury (80%) and Sturry Church of England Primary School (78%).
At GCSE in 2026 (provisional figures), 3 of the 7 secondary schools in Canterbury with published results scored above the England average Attainment 8 of 46.2, an average of about grade 4.6 across eight subjects. The average across Canterbury's schools was 49.9.
One dot per school; hover or tap a dot for its name.
| School | Value |
|---|---|
| Simon Langton Grammar School for Boys | 69.4 |
| Barton Court Grammar School | 66.1 |
| Simon Langton Girls' Grammar School | 66.0 |
| St Anselm's Catholic School, Canterbury | 45.0 |
| Orion Spires | 39.2 |
| The Canterbury Academy | 35.2 |
| The Archbishop's School | 32.1 |
Highest Attainment 8: Simon Langton Grammar School for Boys (69.4), Barton Court Grammar School (66.1) and Simon Langton Girls' Grammar School (66.0).
Independent schools' GCSE results are not published in these tables, so the 5 independent secondary schools here are not included.
Source: Department for Education performance data. Schools with fewer than 11 pupils taking the tests are left out of the highest list, because a few pupils swing the figures.
For state schools you apply through your home council, which for families living in Canterbury is Kent council, even if the school you want is in another council area. You list your preferences on one form, and the council makes one offer.
More: Applying for schools in Kent, and school admissions on GOV.UK.