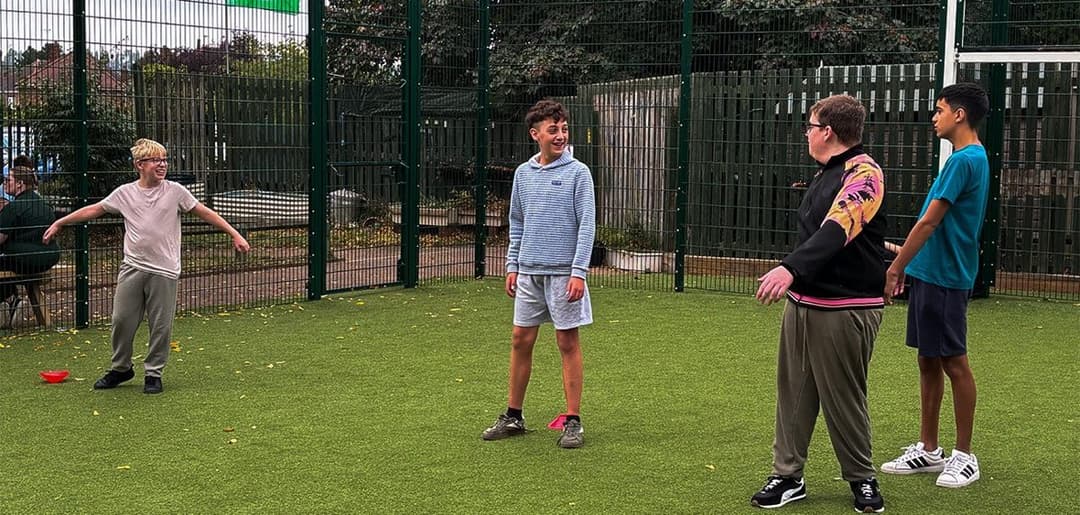
ALP Leicester
Ages 6 to 19 · boys and girls
There are 93 open schools in Leicester: 72 primary schools and 14 secondary schools. 6 are independent and 87 are state-funded, including 1 state special school. Admissions for state schools in Leicester are run by Leicestershire.
Ofsted stopped single-word grades in September 2024. Of the other schools, 13 have a new-style report card instead; 15 had a graded inspection with no overall grade; 2 independent schools are inspected by ISI.
Ages 6 to 19 · boys and girls
Ages 5 to 16 · boys and girls
Ages 3 to 19 · boys and girls
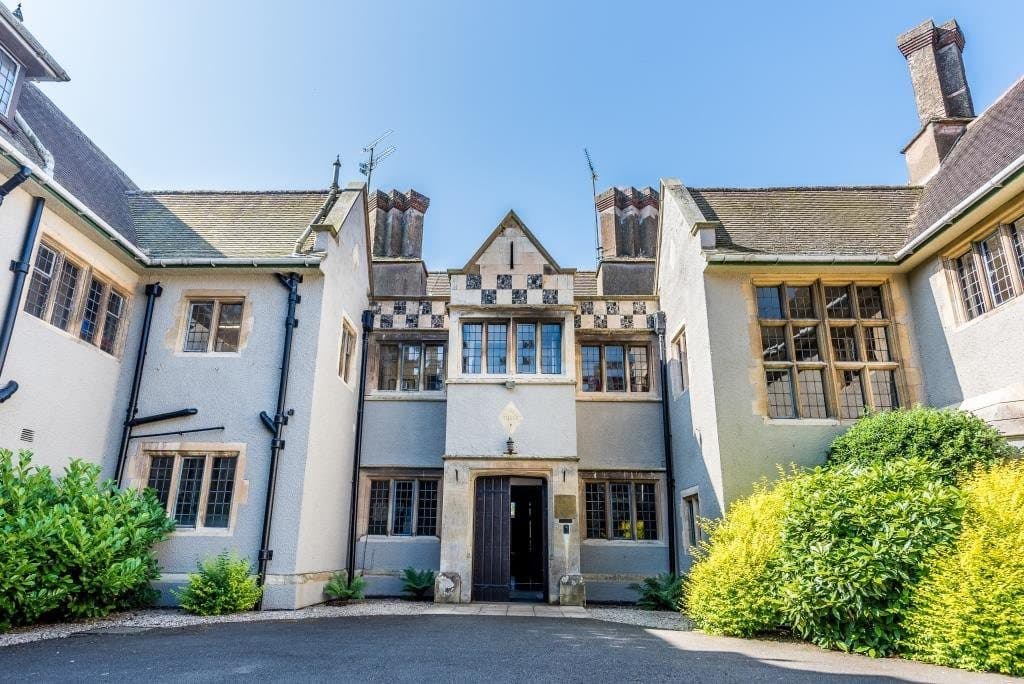
Ages 3 to 16 · boys and girls
Ages 8 to 19 · boys and girls
Ages 7 to 16 · boys and girls
In the 2025 Year 6 tests, 38 of the 67 primary schools in Leicester with published results had a bigger share of pupils reaching the expected standard in reading, writing and maths than the England average of 62%. Across Leicester, 65% of Year 6 pupils reached it.
One dot per school; hover or tap a dot for its name. Paler dots: fewer than 11 pupils took part.
| School | Value |
|---|---|
| Tugby Church of England Primary School | 100% (fewer than 11 pupils) |
| Brocks Hill Primary School | 97% |
| The Pastures Primary School | 93% |
| Brookside Primary School | 92% |
| Broomfield Community Primary School | 89% |
| Cossington Church of England Primary School | 88% |
| Elizabeth Woodville Primary School | 87% |
| Hallam Fields, Birstall | 85% |
| Woodland Grange Primary School | 83% |
| Kirby Muxloe Primary School | 82% |
| Fossebrook Primary School | 80% |
| Millfield L.E.A.D. Academy | 78% |
| Kibworth Church of England Primary School | 77% |
| Red Hill Field Primary School | 77% |
| Badgerbrook Primary School | 76% |
| St Peter's Church of England Primary School Whetstone | 76% |
| Cosby Primary School | 74% |
| Claybrooke Primary School | 73% |
| Old Mill Primary School | 73% |
| Stafford Leys Community Primary School | 73% |
| Desford Community Primary School | 71% |
| Enderby Danemill Primary School | 71% |
| Greystoke Primary School | 71% |
| Thurnby, St Luke's Church of England Primary School | 71% |
| Lady Jane Grey Primary School | 70% |
| Langmoor Primary School Oadby | 70% |
| The Pochin School | 70% |
| Gaddesby Primary School | 69% |
| Rothley Church of England Primary School | 69% |
| The Latimer Primary School | 69% |
| Manorfield Church of England Primary School | 66% |
| Huncote Primary School | 65% |
| New Lubbesthorpe Primary School | 65% |
| Townlands Church of England Primary School | 65% |
| Glen Hills Primary School | 64% |
| Greenfield Primary School | 64% |
| Houghton-on-the-Hill Church of England Primary School | 64% |
| Thurlaston Church of England Primary School | 64% |
| Great Glen St Cuthbert's Church of England Primary School | 60% |
| Newtown Linford Primary School | 60% (fewer than 11 pupils) |
| Ratby Primary School | 58% |
| Ravenhurst Primary School | 58% |
| St Peter and St Paul Church of England Academy | 58% |
| The Merton Primary School | 58% |
| Church Hill Church of England Junior School | 57% |
| Glenfield Primary School | 57% |
| Martinshaw Primary School | 57% |
| Richard Hill Church of England Primary School | 56% |
| Riverside Community Primary School Birstall | 56% |
| Thrussington Church of England Primary School | 56% (fewer than 11 pupils) |
| All Saints Church of England Primary School, Sapcote | 55% |
| Woolden Hill Primary School | 55% |
| Bishop Ellis Catholic Voluntary Academy | 53% |
| Queniborough Church of England Primary School | 52% |
| Eastfield Primary School | 51% |
| Fleckney Church of England Primary School | 51% |
| Highcliffe Primary School and Community Centre | 49% |
| Kingsway Primary School | 49% |
| Barwell Church of England Junior School | 48% |
| Blaby Thistly Meadow Primary School | 48% |
| Billesdon Church of England Primary School | 44% (fewer than 11 pupils) |
| Newlands Community Primary School | 43% |
| Fernvale Primary School | 39% |
| Blaby Stokes Church of England Primary School | 34% |
| Newbold Verdon Primary School | 31% |
| St Simon and St Jude CofE Primary School | 30% |
| Croft Church of England Primary School | 25% (fewer than 11 pupils) |
Highest share reaching the expected standard: Brocks Hill Primary School (97%), The Pastures Primary School (93%) and Brookside Primary School (92%).
At GCSE in 2026 (provisional figures), 8 of the 14 secondary schools in Leicester with published results scored above the England average Attainment 8 of 46.2, an average of about grade 4.6 across eight subjects. The average across Leicester's schools was 47.5.
One dot per school; hover or tap a dot for its name.
| School | Value |
|---|---|
| Manor High School | 60.4 |
| Beauchamp College | 55.9 |
| Gartree High School | 54.1 |
| Brookvale Groby Learning Campus | 48.9 |
| Brockington College | 47.5 |
| The Martin High School Anstey | 47.3 |
| Kibworth Mead Academy | 46.9 |
| Bosworth Academy | 46.7 |
| The Cedars Academy | 45.4 |
| The Roundhill Academy | 44.5 |
| Heath Lane Academy | 41.2 |
| Thomas Estley Community College | 40.9 |
| Wreake Valley Academy | 39.1 |
| The Winstanley School | 34.9 |
Highest Attainment 8: Manor High School (60.4), Beauchamp College (55.9) and Gartree High School (54.1).
Independent schools' GCSE results are not published in these tables, so the 3 independent secondary schools here are not included.
Source: Department for Education performance data. Schools with fewer than 11 pupils taking the tests are left out of the highest list, because a few pupils swing the figures.
For state schools you apply through your home council, which for families living in Leicester is Leicestershire council, even if the school you want is in another council area. You list your preferences on one form, and the council makes one offer.
More: Applying for schools in Leicestershire, and school admissions on GOV.UK.