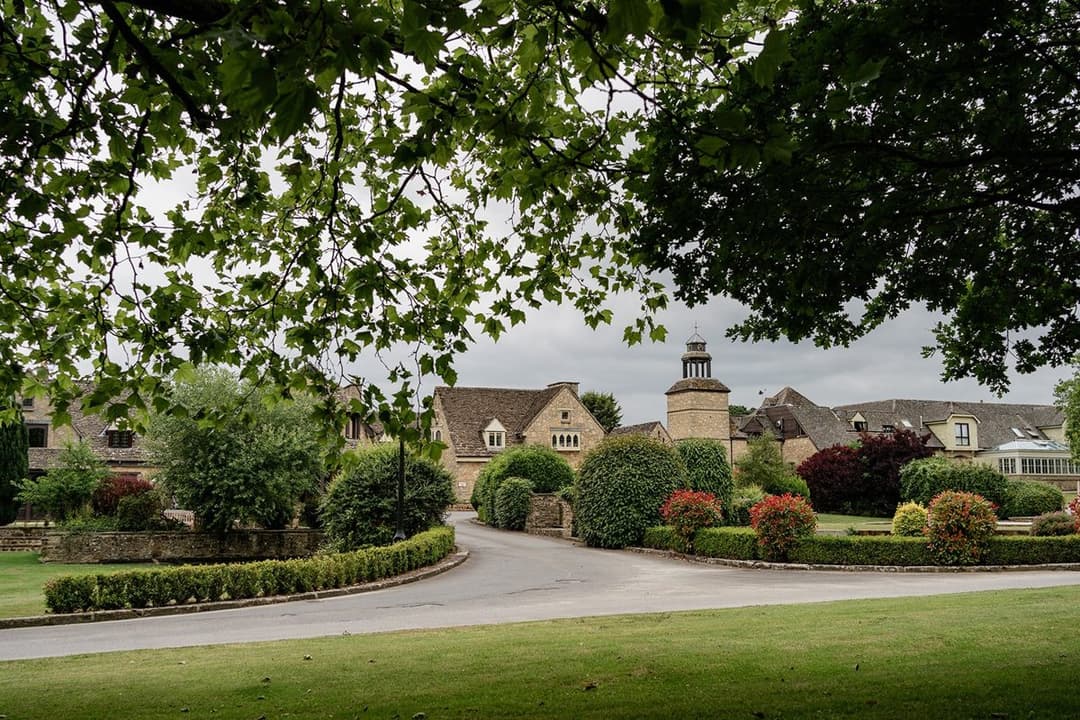
Chandlings Prep
Ages 2 to 11 · boys and girls
From £6,873 a year
There are 91 open schools in Oxford: 48 primary schools, 8 secondary schools, 5 nursery schools and 2 sixth form colleges. 19 are independent and 70 are state-funded, including 8 state special schools. Admissions for state schools in Oxford are run by Oxfordshire.
Ofsted stopped single-word grades in September 2024. Of the other schools, 5 have a new-style report card instead; 6 had a graded inspection with no overall grade; 18 independent schools are inspected by ISI.
Ages 2 to 11 · boys and girls
From £6,873 a year
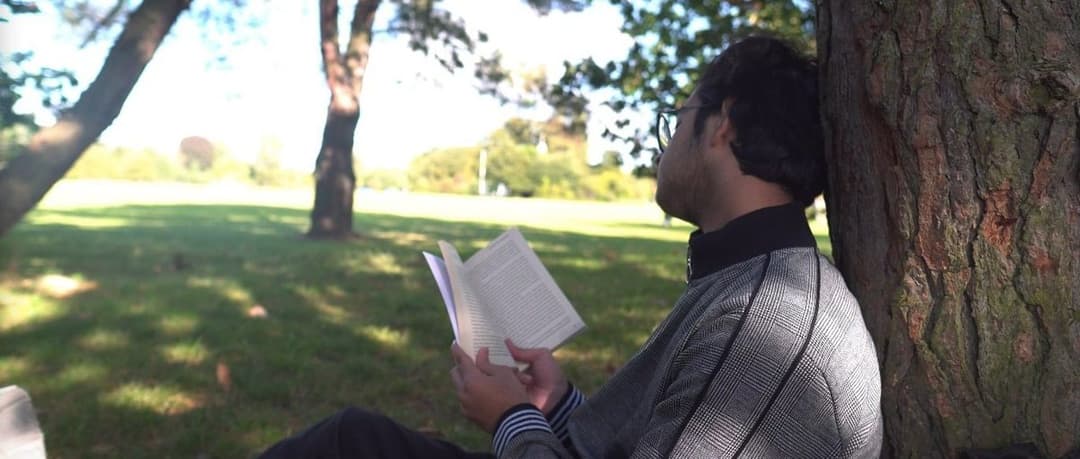
Ages 12 to 25 · boys and girls
Ages 5 to 12 · boys and girls
Ages 2 to 13 · boys and girls
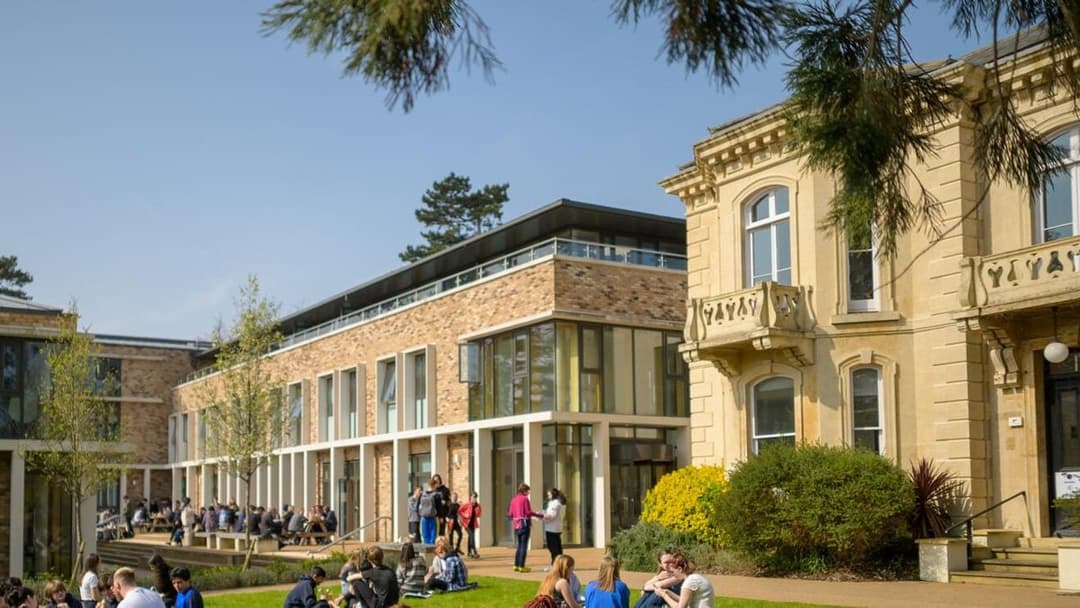
Ages 11 to 19 · boys and girls
Ages 4 to 14 · boys and girls
Ages 3 to 11 · boys and girls
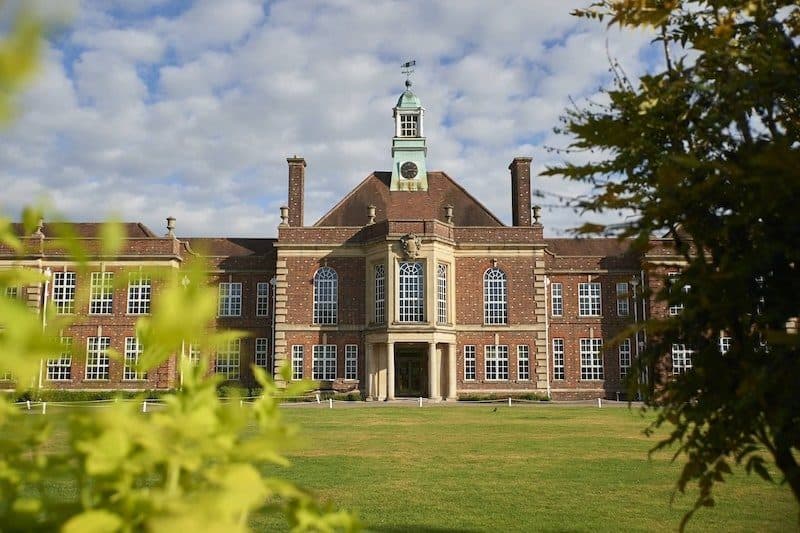
Ages 3 to 19 · girls
In the 2025 Year 6 tests, 27 of the 46 primary schools in Oxford with published results had a bigger share of pupils reaching the expected standard in reading, writing and maths than the England average of 62%. Across Oxford, 64% of Year 6 pupils reached it.
One dot per school; hover or tap a dot for its name. Paler dots: fewer than 11 pupils took part.
| School | Value |
|---|---|
| Wolvercote Primary School | 86% |
| Our Lady's Roman Catholic Primary School | 81% |
| St Aloysius' Catholic Primary School | 79% |
| East Oxford Primary School | 78% |
| St Joseph's Catholic Primary School, Oxford | 78% |
| Wheatley Church of England Primary School | 76% |
| St Philip and James' Church of England Aided Primary School Oxford | 75% |
| St Swithun's CofE Primary School | 73% |
| Windale Primary School | 73% |
| St Michael's CofE Primary School, Oxford City | 72% |
| North Hinksey Church of England Primary School | 71% |
| Wootton St Peter's Church of England Primary School | 70% (fewer than 11 pupils) |
| John Henry Newman Academy | 69% |
| Stadhampton Primary School | 69% |
| St Barnabas' Church of England Aided Primary School | 69% |
| Garsington Church of England Primary School | 68% |
| New Marston Primary School | 68% |
| Wood Farm Primary School | 68% |
| Bayards Hill School | 67% |
| Beckley Church of England Primary School | 67% |
| Cumnor Church of England School (Voluntary Controlled) | 67% |
| Horspath Church of England Primary School | 67% |
| St Andrew's Church of England Primary School, Oxford | 67% |
| St John Fisher Catholic Primary School, Littlemore | 65% |
| Larkrise Primary School | 64% |
| Great Milton Church of England Primary School | 63% |
| Pegasus School | 63% |
| St Mary and St John Church of England Primary School | 62% |
| Cutteslowe Primary School | 60% |
| Church Cowley St James Church of England Primary School | 59% |
| Tyndale Community School | 59% |
| West Oxford Community Primary School | 58% |
| William Fletcher Primary School | 58% |
| Windmill Primary School | 58% |
| Sandhills Community Primary School | 57% |
| St Nicholas' Primary and Nursery School | 57% |
| Orchard Meadow Primary School | 56% |
| Barton Park Primary School | 55% |
| St Francis Church of England Primary School | 55% |
| St Ebbe's Church of England Aided Primary School | 54% |
| Botley School | 53% |
| St Christopher's Church of England School, Cowley | 53% |
| New Hinksey Church of England Primary School | 48% |
| Chalgrove Community Primary School | 40% |
| Rose Hill Primary School | 34% |
| St Frideswide Church of England Primary School | 33% |
Highest share reaching the expected standard: Wolvercote Primary School (86%), Our Lady's Roman Catholic Primary School (81%) and St Aloysius' Catholic Primary School (79%).
At GCSE in 2026 (provisional figures), 6 of the 8 secondary schools in Oxford with published results scored above the England average Attainment 8 of 46.2, an average of about grade 4.6 across eight subjects. The average across Oxford's schools was 49.1.
One dot per school; hover or tap a dot for its name.
| School | Value |
|---|---|
| The Swan School | 60.1 |
| The Cherwell School | 58.9 |
| Wheatley Park School | 55.8 |
| Matthew Arnold School | 48.6 |
| Oxford Spires Academy | 47.7 |
| Cheney School | 47.0 |
| Greyfriars Catholic School | 34.7 |
| The Oxford Academy | 31.2 |
Highest Attainment 8: The Swan School (60.1), The Cherwell School (58.9) and Wheatley Park School (55.8).
Independent schools' GCSE results are not published in these tables, so the 9 independent secondary schools here are not included.
Source: Department for Education performance data. Schools with fewer than 11 pupils taking the tests are left out of the highest list, because a few pupils swing the figures.
For state schools you apply through your home council, which for families living in Oxford is Oxfordshire council, even if the school you want is in another council area. You list your preferences on one form, and the council makes one offer.
More: Applying for schools in Oxfordshire, and school admissions on GOV.UK.