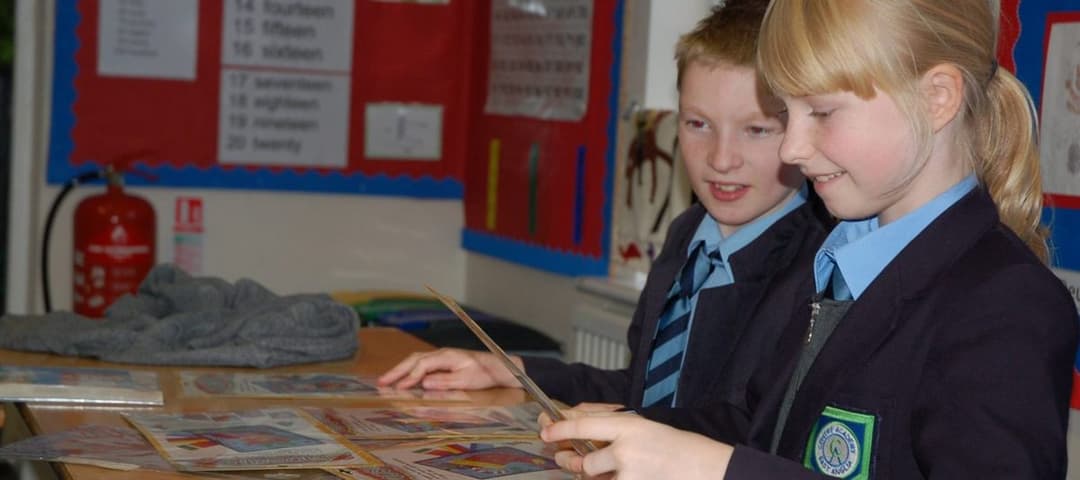
Centre Academy East Anglia
Ages 7 to 19 · boys and girls
There are 96 open schools in Ipswich: 62 primary schools, 12 secondary schools, 1 nursery school and 2 sixth form colleges. 9 are independent and 86 are state-funded, including 5 state special schools. Admissions for state schools in Ipswich are run by Suffolk.
Ofsted stopped single-word grades in September 2024. Of the other schools, 11 have a new-style report card instead; 13 had a graded inspection with no overall grade; 7 independent schools are inspected by ISI.
Ages 7 to 19 · boys and girls
Ages 3 to 19 · boys and girls
Ages 0 to 18 · boys and girls
Ages 11 to 19 · boys and girls
Ages 2 to 13 · boys and girls
Ages 2 to 14 · boys and girls
Ages 7 to 16 · boys and girls
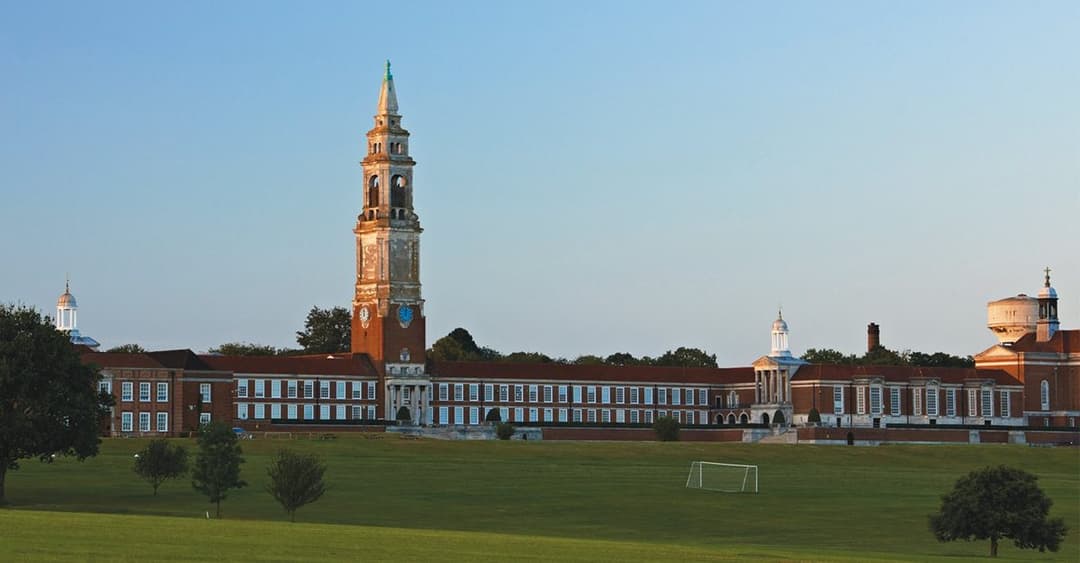
Ages 11 to 18 · boys and girls
In the 2025 Year 6 tests, 21 of the 55 primary schools in Ipswich with published results had a bigger share of pupils reaching the expected standard in reading, writing and maths than the England average of 62%. Across Ipswich, 57% of Year 6 pupils reached it.
One dot per school; hover or tap a dot for its name. Paler dots: fewer than 11 pupils took part.
| School | Value |
|---|---|
| Sproughton Church of England Primary School | 87% |
| St John's Church of England Voluntary Aided Primary School, Ipswich | 87% |
| St Mary's Catholic Primary School, Ipswich | 75% |
| Broke Hall Community Primary School | 74% |
| Cliff Lane Primary School | 74% |
| Bildeston Primary School | 73% |
| Birchwood Primary School | 73% |
| Halifax Primary School | 72% |
| St Pancras Catholic Primary School | 72% |
| Bucklesham Primary School | 71% (fewer than 11 pupils) |
| Sprites Primary Academy | 71% |
| Holbrook Primary School | 68% |
| Dale Hall Community Primary School | 67% |
| Henley Primary School | 67% |
| The Oaks Primary School | 67% |
| Chelmondiston Church of England Primary School | 64% |
| Britannia Primary School and Nursery | 63% |
| Capel St Mary Church of England Voluntary Controlled Primary School | 63% |
| Gorseland Primary School | 63% |
| Ravenswood Community Primary School | 63% |
| St Margaret's CEVAP School, Ipswich | 63% |
| Handford Hall Primary School | 62% |
| Murrayfield Primary - A Paradigm Academy | 60% |
| Rose Hill Primary | 59% |
| Rushmere Hall Primary School | 59% |
| Heath Primary School, Kesgrave | 58% |
| Castle Hill Junior School | 57% |
| Cedarwood Primary School | 57% |
| Claydon Primary School | 57% |
| Clifford Community Primary School & Nursery | 57% |
| Hintlesham and Chattisham Church of England Primary School | 57% |
| Somersham Primary School | 56% |
| Gusford Community Primary School | 55% |
| Witnesham Primary School | 55% |
| Bramford Church of England Voluntary Controlled Primary School | 54% |
| Hillside Primary School | 53% |
| Nacton Church of England Primary School | 53% |
| St Helen's Primary School | 53% |
| Sidegate Primary School | 51% |
| Copdock Primary School | 50% |
| Stutton Church of England Primary School | 50% |
| The Beeches Community Primary School | 50% |
| Springfield Junior School | 49% |
| St Matthew's Church of England Primary School, Ipswich | 47% |
| St Mary's Church of England Primary School, Hadleigh | 46% |
| Whitehouse Community Primary School | 46% |
| Piper's Vale Primary - A Paradigm Academy | 44% |
| Tattingstone Church of England Voluntary Controlled Primary School | 43% (fewer than 11 pupils) |
| Elmsett Church of England Primary School | 38% |
| Morland Church of England Primary School | 36% |
| The Willows Primary School | 35% |
| Otley Primary School | 33% (fewer than 11 pupils) |
| Bosmere Community Primary School | 30% |
| Ranelagh Primary School | 23% |
| Shotley Community Primary School | 9% |
Highest share reaching the expected standard: Sproughton Church of England Primary School (87%), St John's Church of England Voluntary Aided Primary School, Ipswich (87%) and St Mary's Catholic Primary School, Ipswich (75%).
At GCSE in 2026 (provisional figures), 3 of the 12 secondary schools in Ipswich with published results scored above the England average Attainment 8 of 46.2, an average of about grade 4.6 across eight subjects. The average across Ipswich's schools was 43.6.
One dot per school; hover or tap a dot for its name.
| School | Value |
|---|---|
| Northgate High School | 49.5 |
| Copleston High School | 48.3 |
| Kesgrave High School | 47.0 |
| Hadleigh High School | 45.6 |
| St Alban's Catholic High School | 45.3 |
| Claydon High School | 45.2 |
| Ormiston Endeavour Academy | 40.4 |
| Ipswich Academy | 40.3 |
| Holbrook Academy | 40.1 |
| Westbourne Academy | 38.2 |
| Chantry Academy | 36.7 |
| Stoke High School - Ormiston Academy | 36.0 |
Highest Attainment 8: Northgate High School (49.5), Copleston High School (48.3) and Kesgrave High School (47.0).
Independent schools' GCSE results are not published in these tables, so the 4 independent secondary schools here are not included.
Source: Department for Education performance data. Schools with fewer than 11 pupils taking the tests are left out of the highest list, because a few pupils swing the figures.
For state schools you apply through your home council, which for families living in Ipswich is Suffolk council, even if the school you want is in another council area. You list your preferences on one form, and the council makes one offer.
More: Applying for schools in Suffolk, and school admissions on GOV.UK.