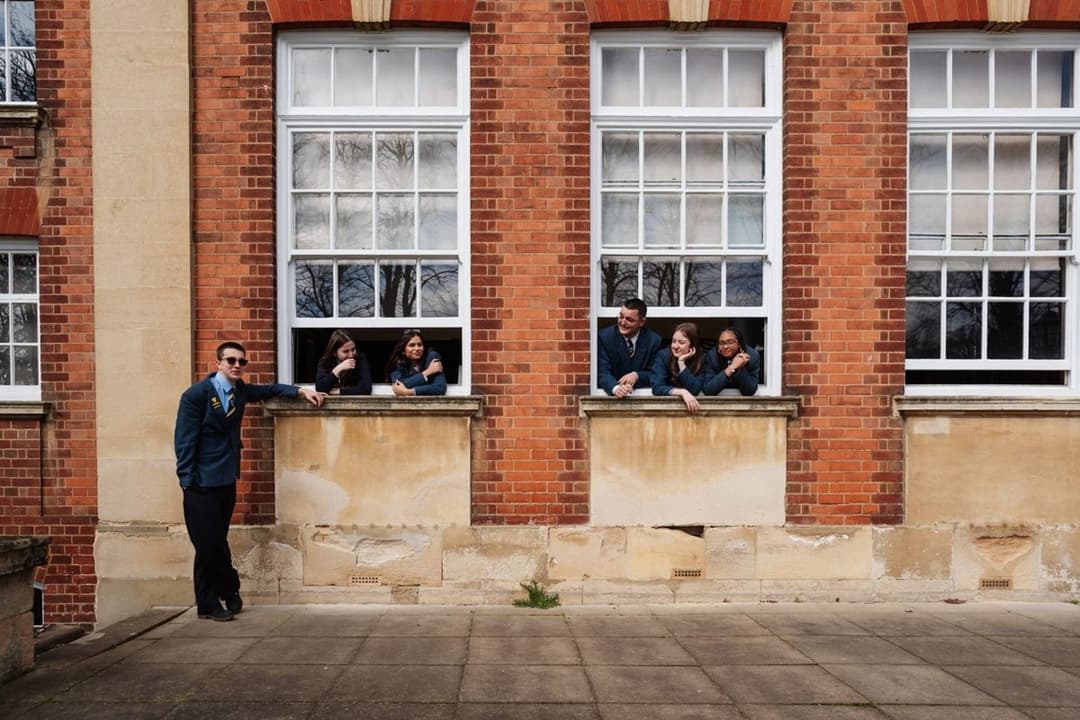
Bosworth Independent School
Ages 11 to 22 · boys and girls
There are 141 open schools in Northampton: 97 primary schools, 12 secondary schools, 4 all-through schools, 5 nursery schools and 2 sixth form colleges. 10 are independent and 128 are state-funded, including 7 state special schools. Admissions for state schools in Northampton are run by West Northamptonshire.
Ofsted stopped single-word grades in September 2024. Of the other schools, 19 have a new-style report card instead; 21 had a graded inspection with no overall grade; 6 independent schools are inspected by ISI.
Ages 11 to 22 · boys and girls
Ages 11 to 16 · boys and girls
Ages 7 to 16 · boys and girls
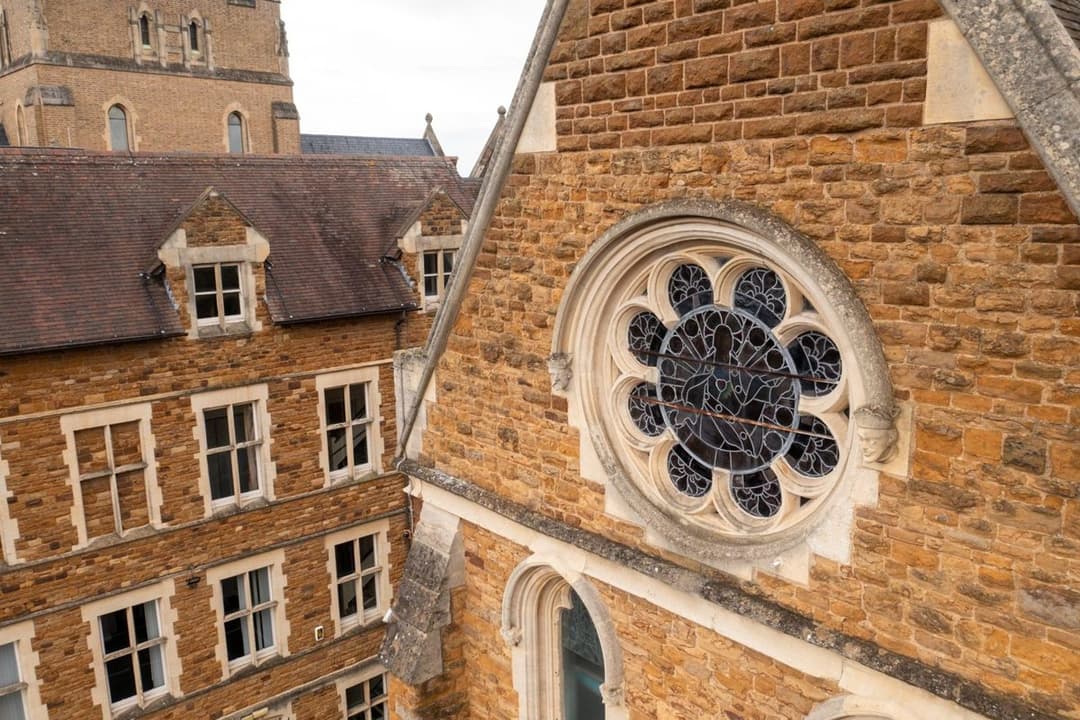
Ages 6 to 18 · boys and girls
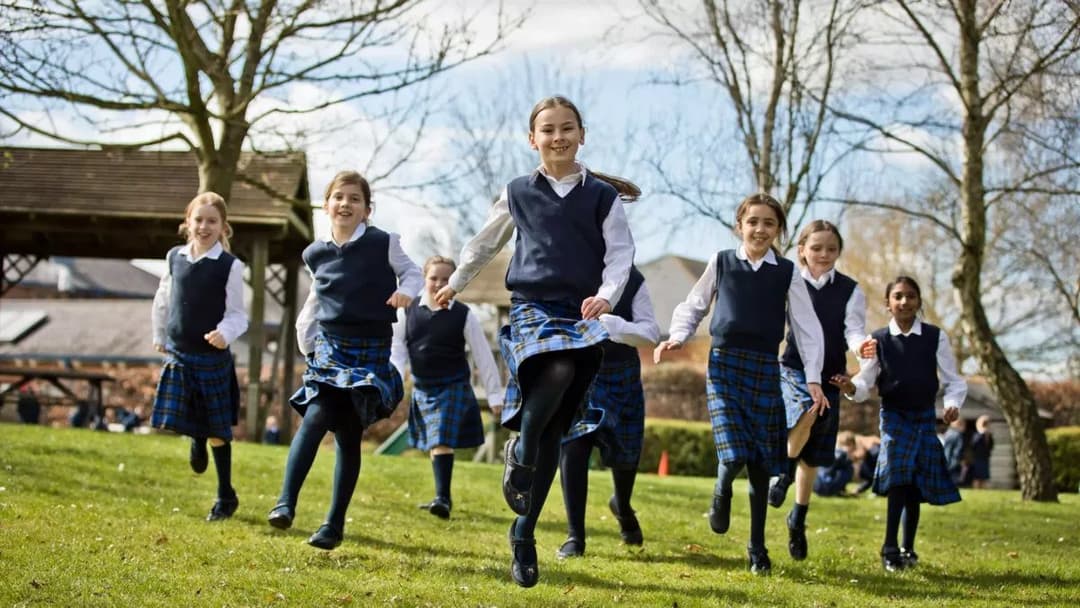
Ages 2 to 18 · girls
Ages 7 to 18 · boys and girls
Ages 11 to 19 · boys and girls
Ages 2 to 18 · boys and girls
In the 2025 Year 6 tests, 55 of the 96 primary schools in Northampton with published results had a bigger share of pupils reaching the expected standard in reading, writing and maths than the England average of 62%. Across Northampton, 65% of Year 6 pupils reached it.
One dot per school; hover or tap a dot for its name. Paler dots: fewer than 11 pupils took part.
| School | Value |
|---|---|
| Hartwell Primary School | 96% |
| Hackleton CofE Primary School | 94% |
| The Bramptons Primary School | 92% |
| Parklands Primary School | 87% |
| Pineham Barns Primary School | 87% |
| Yardley Hastings Primary School | 87% |
| West Haddon Endowed Church of England Primary School | 86% |
| Abington Vale Primary School | 83% |
| The Arbours Primary Academy | 83% |
| Eastfield Academy | 82% |
| The Bliss Charity School | 82% |
| Preston Hedges Primary School | 81% |
| Blisworth Community Primary School | 80% |
| Weston Favell CofE Primary School | 80% |
| Brington Primary School | 78% (fewer than 11 pupils) |
| Duston Eldean Primary School | 77% |
| Brixworth CofE VC Primary School | 76% |
| Wootton Park School | 76% |
| Malcolm Arnold Preparatory School | 75% |
| Kislingbury Primary School | 74% |
| Long Buckby Junior School | 74% |
| Walgrave Primary School | 74% |
| Briar Hill Primary School & Nursery | 73% |
| Bridgewater Primary School | 73% |
| Cedar Road Primary School | 73% |
| East Haddon Church of England Primary School | 73% |
| Flore Church of England Primary School | 73% |
| Guilsborough Church of England Primary School | 73% |
| Caroline Chisholm School | 72% |
| St Luke's Church of England Primary School | 72% |
| The Abbey Primary School | 72% |
| The Duston School | 72% |
| Kings Heath Primary Academy | 71% |
| Pitsford Primary School | 71% (fewer than 11 pupils) |
| Ecton Brook Primary School | 70% |
| Lumbertubs Primary School | 70% |
| Roade Primary School | 70% |
| Woodland View Primary School | 70% |
| Castle Academy | 69% |
| St James Church of England Primary School | 69% |
| Blackthorn Primary School | 68% |
| Harpole Primary School | 68% |
| Thorplands Primary School | 68% |
| Wootton Primary School | 68% |
| Cogenhoe Primary School | 67% |
| Maidwell Primary School | 67% (fewer than 11 pupils) |
| Simon de Senlis Primary School | 67% |
| Moulton Primary School | 66% |
| Queen Eleanor Primary Academy | 66% |
| Standens Barn Primary School | 66% |
| East Hunsbury Primary School | 63% |
| Gayton Church of England Primary School | 63% (fewer than 11 pupils) |
| Overstone Primary School | 63% |
| St Gregory's Catholic Primary School | 63% |
| Welford Sibbertoft and Sulby Endowed School | 63% (fewer than 11 pupils) |
| Collingtree Church of England Primary School | 62% |
| Spring Lane Primary School | 62% |
| Whitehills Primary School | 62% |
| Millway Primary School | 61% |
| Headlands Primary School | 60% |
| Spratton Church of England Primary School | 60% (fewer than 11 pupils) |
| St Andrew's Ceva Primary School | 60% |
| Vernon Terrace Primary School | 59% |
| Barry Primary School | 58% |
| Hopping Hill Primary School | 58% |
| Stimpson Avenue Academy | 58% |
| Yelvertoft Primary School | 58% |
| Boughton Primary School | 57% |
| The Good Shepherd Catholic Primary School | 57% |
| Upton Meadows Primary School | 57% |
| Bugbrooke Community Primary School | 56% |
| Earl Spencer Primary School | 56% |
| Hardingstone Academy | 56% |
| Little Houghton Church of England Primary | 56% |
| Harlestone Primary School | 55% |
| Boothville Primary School | 54% |
| Denton Primary School | 54% |
| All Saints CofE VA Primary School | 53% |
| Green Oaks Primary Academy | 53% |
| Kingsthorpe Village Primary School | 53% |
| Sunnyside Primary Academy | 53% |
| St Mary's Catholic Primary School | 52% |
| Kingsley Primary School | 51% |
| Lings Primary School | 51% |
| Northampton International Academy | 51% |
| Woodvale Primary Academy | 51% |
| Rothersthorpe Church of England Primary School | 50% |
| Chiltern Primary School | 49% |
| Delapre Primary School | 49% |
| Lyncrest Primary School | 45% |
| Rectory Farm Primary School | 45% |
| Ashton CofE Primary School | 43% (fewer than 11 pupils) |
| Kingsthorpe Grove Primary School | 42% |
| Crick Primary School | 39% |
| Weedon Bec Primary School | 30% |
| Milton Parochial Primary School | 29% |
Highest share reaching the expected standard: Hartwell Primary School (96%), Hackleton CofE Primary School (94%) and The Bramptons Primary School (92%).
At GCSE in 2026 (provisional figures), 6 of the 15 secondary schools in Northampton with published results scored above the England average Attainment 8 of 46.2, an average of about grade 4.6 across eight subjects. The average across Northampton's schools was 47.8.
One dot per school; hover or tap a dot for its name.
| School | Value |
|---|---|
| Northampton School for Girls | 59.2 |
| Northampton School for Boys | 59.0 |
| Wootton Park School | 54.7 |
| Northampton Academy | 53.3 |
| Caroline Chisholm School | 52.0 |
| Guilsborough Academy | 46.6 |
| The Duston School | 46.0 |
| Weston Favell Academy | 44.9 |
| Campion School | 44.8 |
| Abbeyfield School | 44.6 |
| Malcolm Arnold Academy | 44.4 |
| Kingsthorpe College | 43.5 |
| Moulton School and Science College | 42.6 |
| St Thomas Becket Catholic School | 41.5 |
| Northampton International Academy | 38.9 |
Highest Attainment 8: Northampton School for Girls (59.2), Northampton School for Boys (59.0) and Wootton Park School (54.7).
Independent schools' GCSE results are not published in these tables, so the 5 independent secondary schools here are not included.
Source: Department for Education performance data. Schools with fewer than 11 pupils taking the tests are left out of the highest list, because a few pupils swing the figures.
For state schools you apply through your home council, which for families living in Northampton is West Northamptonshire council, even if the school you want is in another council area. You list your preferences on one form, and the council makes one offer.
More: school admissions on GOV.UK.