
Azhar Academy Girls School
Ages 3 to 16 · boys and girls
There are 107 open schools in London: 64 primary schools, 17 secondary schools, 3 all-through schools, 7 nursery schools and 3 sixth form colleges. 7 are independent and 99 are state-funded, including 3 state special schools. Admissions for state schools in London are run by Newham.
Ofsted stopped single-word grades in September 2024. Of the other schools, 14 have a new-style report card instead; 12 had a graded inspection with no overall grade; 2 independent schools are inspected by ISI.
Ages 3 to 16 · boys and girls
Ages 7 to 19 · boys and girls
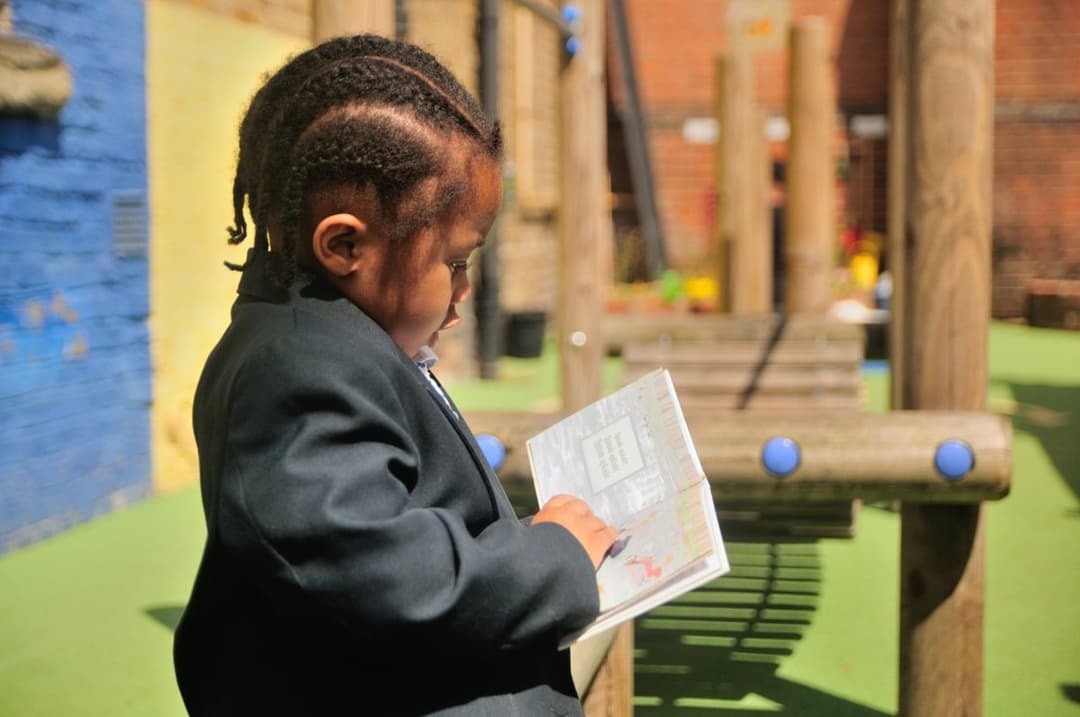
Ages 2 to 11 · boys and girls
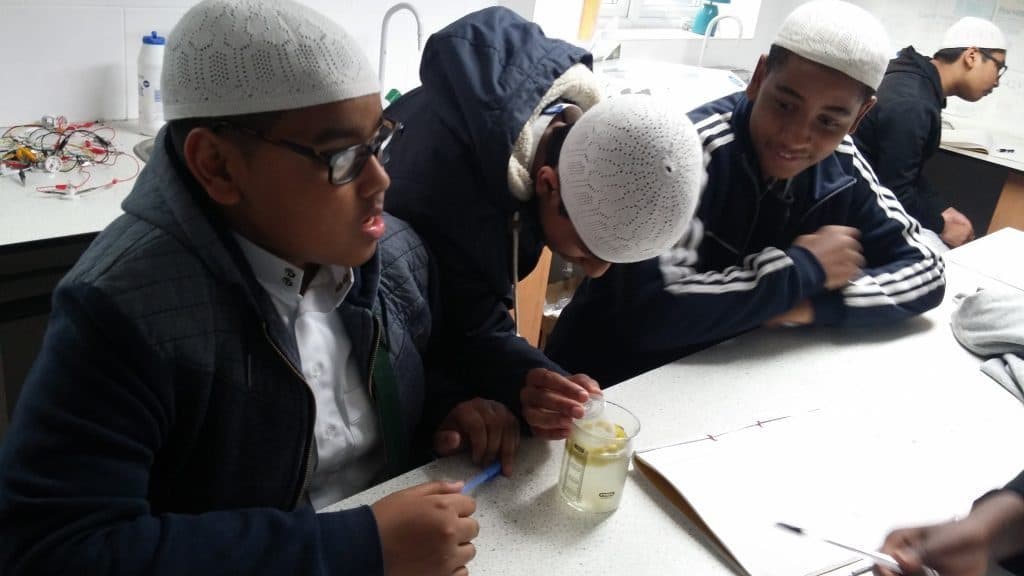
Ages 7 to 16 · boys
Ages 3 to 11 · boys and girls
Ages 3 to 16 · boys and girls
Ages 5 to 11 · boys and girls
In the 2025 Year 6 tests, 57 of the 63 primary schools in London with published results had a bigger share of pupils reaching the expected standard in reading, writing and maths than the England average of 62%. Across London, 77% of Year 6 pupils reached it.
One dot per school; hover or tap a dot for its name.
| School | Value |
|---|---|
| St Antony's Catholic Primary School | 97% |
| Roman Road Primary School | 94% |
| Elmhurst Primary School | 92% |
| Bobby Moore Academy | 91% |
| Rosetta Primary School | 91% |
| Tollgate Primary School | 91% |
| Shaftesbury Primary School | 89% |
| St Stephen's Primary School | 89% |
| Ravenscroft Primary School | 88% |
| Vicarage Primary School | 88% |
| Langdon Academy | 87% |
| Hallsville Primary School | 86% |
| Harris Academy Chobham | 85% |
| Keir Hardie Primary School | 85% |
| Scott Wilkie Primary School | 85% |
| Cleves Primary School | 84% |
| Earlham Primary School | 84% |
| New City Primary School | 84% |
| Kaizen Primary School | 83% |
| Monega Primary School | 83% |
| St Luke's Primary School | 83% |
| Curwen Primary School | 82% |
| St Winefride's RC Primary School | 82% |
| Essex Primary School | 81% |
| Sir John Heron Primary School | 81% |
| St Michael's Catholic Primary School | 81% |
| Colegrave Primary School | 80% |
| Dersingham Primary School | 80% |
| St Edward's Catholic Primary School | 80% |
| Avenue Primary School | 78% |
| Grange Primary School | 78% |
| Lathom Junior School | 77% |
| Ranelagh Primary School | 77% |
| Sandringham Primary School | 77% |
| St Francis' Catholic Primary School | 77% |
| Central Park Primary School | 76% |
| Drew Primary School | 76% |
| Portway Primary School | 76% |
| Selwyn Primary School | 76% |
| North Beckton Primary School | 74% |
| Stratford Manor Primary School & Nursery | 73% |
| Nelson Primary School | 72% |
| Park Primary School | 72% |
| Ellen Wilkinson Primary School | 70% |
| Star Primary School | 70% |
| Plaistow Primary School | 69% |
| St Helen's Catholic Primary School | 68% |
| Gainsborough Primary School | 67% |
| Gallions Primary School | 67% |
| St James' CofE Primary School | 67% |
| St Joachim's Catholic Primary School | 66% |
| Hartley Primary School | 65% |
| Upton Cross Primary School | 65% |
| Maryland Primary School | 64% |
| Brampton Primary School | 63% |
| Britannia Village Primary School | 63% |
| Sheringham Primary School | 63% |
| Carpenters Primary School | 62% |
| Godwin Junior School | 62% |
| William Davies Primary School | 61% |
| Kensington Primary School | 59% |
| Winsor Primary School | 55% |
| West Ham Church Primary School | 42% |
Highest share reaching the expected standard: St Antony's Catholic Primary School (97%), Roman Road Primary School (94%) and Elmhurst Primary School (92%).
At GCSE in 2026 (provisional figures), 17 of the 19 secondary schools in London with published results scored above the England average Attainment 8 of 46.2, an average of about grade 4.6 across eight subjects. The average across London's schools was 51.6.
One dot per school; hover or tap a dot for its name.
| School | Value |
|---|---|
| Brampton Manor Academy | 61.2 |
| Harris Science Academy East London | 59.3 |
| Forest Gate Community School | 59.0 |
| St Angela's Ursuline School | 55.2 |
| Harris Academy Chobham | 53.8 |
| St Bonaventure's RC School | 53.5 |
| Langdon Academy | 52.2 |
| Kingsford Community School | 51.9 |
| Sarah Bonnell School | 51.3 |
| Stratford School Academy | 51.0 |
| Cumberland Community School | 50.3 |
| Rokeby School | 48.4 |
| Lister Community School | 48.1 |
| London Design and Engineering UTC | 47.7 |
| Oasis Academy Silvertown | 47.6 |
| Little Ilford School | 47.5 |
| Eastlea Community School | 46.3 |
| Bobby Moore Academy | 41.2 |
| Royal Docks Academy | 40.0 |
Highest Attainment 8: Brampton Manor Academy (61.2), Harris Science Academy East London (59.3) and Forest Gate Community School (59.0).
Independent schools' GCSE results are not published in these tables, so the 3 independent secondary schools here are not included.
Source: Department for Education performance data. Schools with fewer than 11 pupils taking the tests are left out of the highest list, because a few pupils swing the figures.
For state schools you apply through your home council, which for families living in London is Newham council, even if the school you want is in another council area. You list your preferences on one form, and the council makes one offer.
More: school admissions on GOV.UK.