
Al-Mizan School
Ages 7 to 11 · boys and girls
There are 113 open schools in London: 66 primary schools, 17 secondary schools, 1 all-through school, 3 nursery schools and 3 sixth form colleges. 15 are independent and 94 are state-funded, including 5 state special schools. Admissions for state schools in London are run by Tower Hamlets.
Ofsted stopped single-word grades in September 2024. Of the other schools, 13 have a new-style report card instead; 9 had a graded inspection with no overall grade; 5 independent schools are inspected by ISI.
Ages 7 to 11 · boys and girls
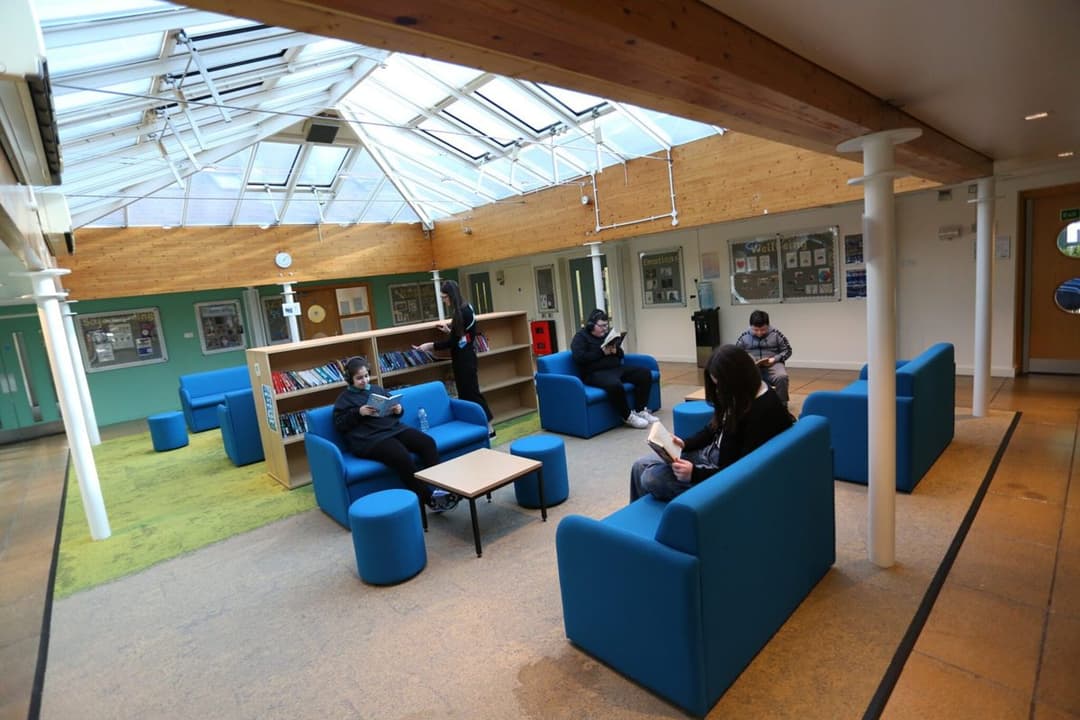
Ages 5 to 18 · boys and girls

Ages 3 to 11 · boys and girls
Ages 5 to 11 · boys and girls
Ages 11 to 20 · boys
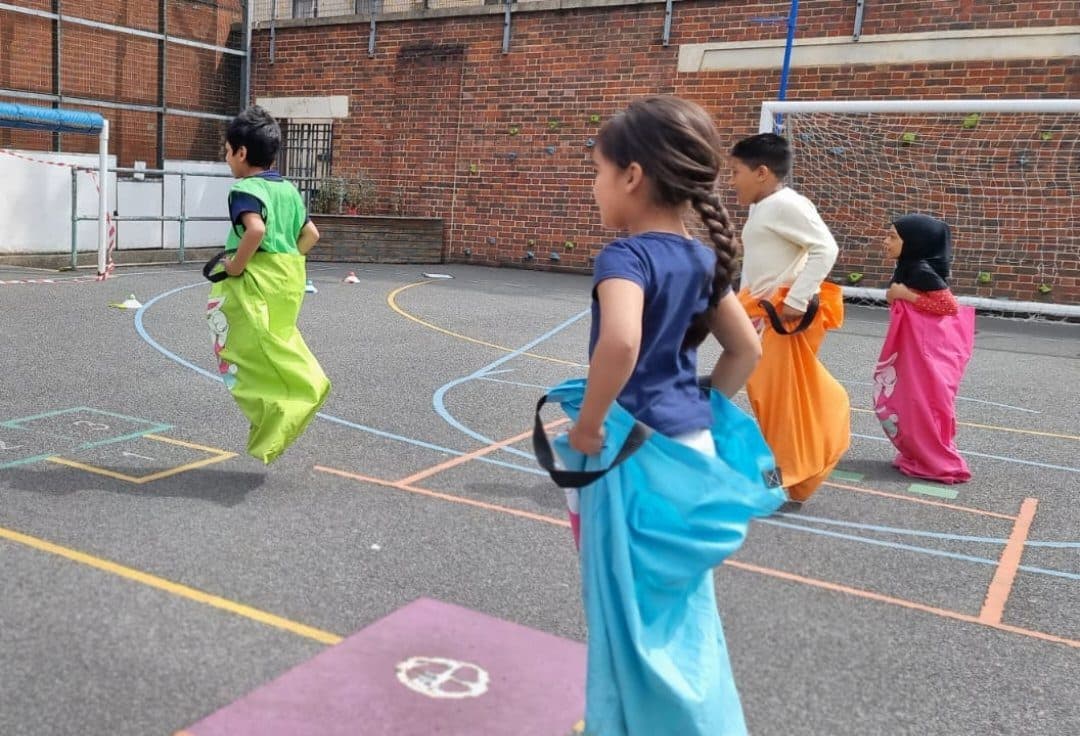
Ages 2 to 11 · boys and girls

Ages 4 to 11 · boys and girls
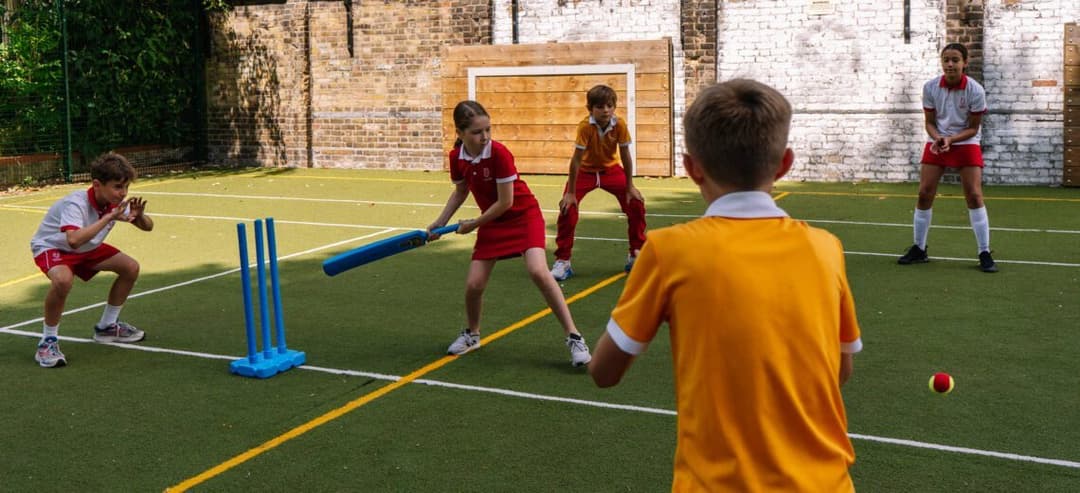
Ages 3 to 11 · boys and girls
In the 2025 Year 6 tests, 52 of the 61 primary schools in London with published results had a bigger share of pupils reaching the expected standard in reading, writing and maths than the England average of 62%. Across London, 71% of Year 6 pupils reached it.
One dot per school; hover or tap a dot for its name.
| School | Value |
|---|---|
| Bigland Green Primary School | 87% |
| Canary Wharf Primary, Glenworth | 85% |
| Stewart Headlam Primary School | 83% |
| St Peter's London Docks CofE Primary School | 83% |
| William Davis Primary School | 83% |
| Columbia Primary School | 81% |
| Globe Primary School | 80% |
| Mayflower Primary School | 80% |
| The Clara Grant Primary School | 80% |
| Bygrove Primary School | 79% |
| Canary Wharf Primary, East Ferry | 79% |
| Hague Primary School | 79% |
| Osmani Primary School | 78% |
| Solebay Primary - A Paradigm Academy | 78% |
| Bangabandhu Primary School | 77% |
| Hermitage Primary School | 77% |
| Manorfield Primary School | 77% |
| Stebon Primary School | 77% |
| Stepney Park Primary School | 77% |
| Blue Gate Fields Junior School | 76% |
| St Mary and St Michael Primary School | 76% |
| Old Palace Primary School | 75% |
| Culloden Primary - A Paradigm Academy | 74% |
| Sir William Burrough Primary School | 74% |
| St Agnes RC Primary School | 73% |
| Ben Jonson Primary School | 72% |
| John Scurr Primary School | 72% |
| Mowlem Primary School | 72% |
| St Paul's Whitechapel Church of England Primary School | 72% |
| Christ Church CofE School | 71% |
| Lansbury Lawrence Primary School | 71% |
| Thomas Buxton Primary School | 71% |
| Wellington Primary School | 71% |
| Woolmore Primary School | 71% |
| Cayley Primary School | 70% |
| Kobi Nazrul Primary School | 70% |
| Lawdale Junior School | 70% |
| Marner Primary School | 69% |
| St Edmund's Catholic School | 69% |
| Halley Primary School | 68% |
| Malmesbury Primary School | 67% |
| St Paul's Way Trust School | 66% |
| Bonner Primary School | 65% |
| Cyril Jackson Primary School | 65% |
| Old Ford Primary - A Paradigm Academy | 65% |
| Marion Richardson Primary School | 64% |
| St John's Church of England Primary School | 64% |
| St Luke's Church of England Primary School | 64% |
| St Saviour's Church of England Primary School | 64% |
| Cubitt Town Primary School | 63% |
| English Martyrs Roman Catholic Primary School | 63% |
| Harbinger Primary School | 63% |
| Olga Primary School | 62% |
| Our Lady and St Joseph Catholic Primary School | 62% |
| Chisenhale Primary School | 61% |
| Stepney Greencoat Church of England Primary School | 61% |
| Arnhem Wharf Primary School | 60% |
| Harry Gosling Primary School | 60% |
| Mulberry Canon Barnett Primary Academy | 59% |
| St Paul With St Luke CofE Primary Federation | 57% |
| Seven Mills Primary School | 55% |
Highest share reaching the expected standard: Bigland Green Primary School (87%), Canary Wharf Primary, Glenworth (85%) and St Peter's London Docks CofE Primary School (83%).
At GCSE in 2026 (provisional figures), 14 of the 18 secondary schools in London with published results scored above the England average Attainment 8 of 46.2, an average of about grade 4.6 across eight subjects. The average across London's schools was 48.0.
One dot per school; hover or tap a dot for its name.
| School | Value |
|---|---|
| Swanlea School | 58.7 |
| Mulberry School for Girls | 57.2 |
| Stepney All Saints Church of England Secondary School | 54.0 |
| Central Foundation Girls' School | 53.0 |
| St Paul's Way Trust School | 52.0 |
| Canary Wharf Secondary | 51.2 |
| Mulberry Stepney Green Mathematics and Computing College | 50.2 |
| London Enterprise Academy | 48.7 |
| Oaklands School | 47.9 |
| Morpeth School | 47.8 |
| George Green's School | 47.7 |
| Wapping High School | 46.9 |
| Langdon Park Community School | 46.6 |
| Mulberry Academy Shoreditch | 46.5 |
| Bishop Challoner Catholic School | 43.8 |
| Bow School | 43.8 |
| Mulberry UTC | 28.6 |
| New City College | 10.0 |
Highest Attainment 8: Swanlea School (58.7), Mulberry School for Girls (57.2) and Stepney All Saints Church of England Secondary School (54.0).
Independent schools' GCSE results are not published in these tables, so the 8 independent secondary schools here are not included.
Source: Department for Education performance data. Schools with fewer than 11 pupils taking the tests are left out of the highest list, because a few pupils swing the figures.
For state schools you apply through your home council, which for families living in London is Tower Hamlets council, even if the school you want is in another council area. You list your preferences on one form, and the council makes one offer.
More: school admissions on GOV.UK.