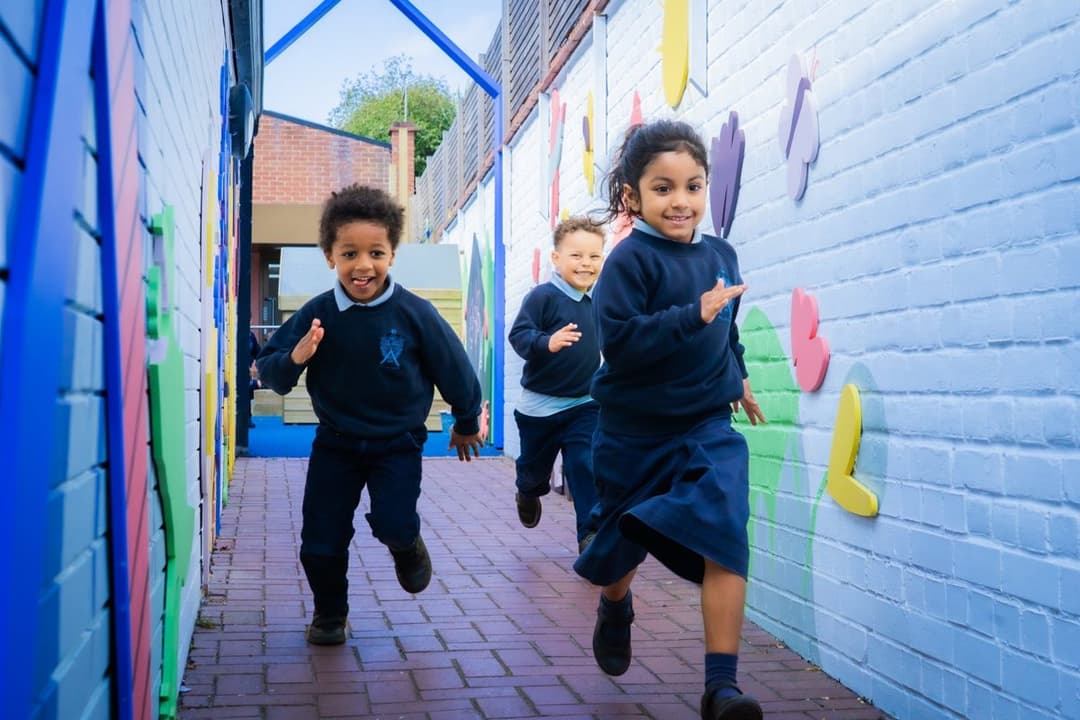
Alleyn's School
Ages 4 to 18 · boys and girls
There are 114 open schools in London: 65 primary schools, 19 secondary schools, 1 all-through school and 4 nursery schools. 13 are independent and 99 are state-funded, including 9 state special schools. Admissions for state schools in London are run by Southwark.
Ofsted stopped single-word grades in September 2024. Of the other schools, 12 have a new-style report card instead; 13 had a graded inspection with no overall grade; 8 independent schools are inspected by ISI.
Ages 4 to 18 · boys and girls
Ages 11 to 16 · boys and girls
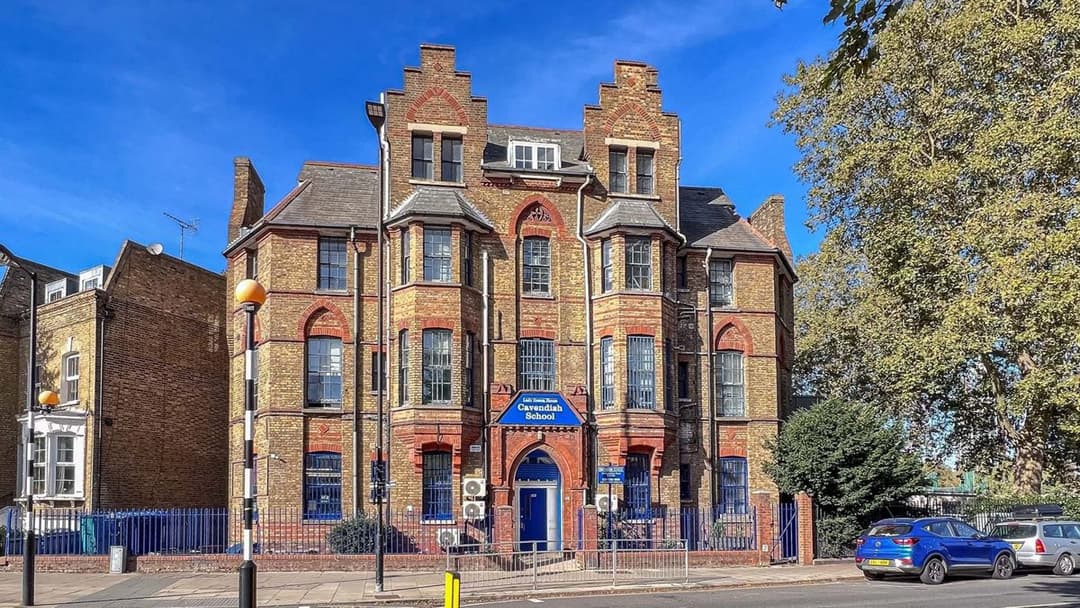
Ages 11 to 16 · boys and girls
Ages 0 to 19 · boys and girls
Ages 2 to 16 · boys
Ages 11 to 16 · boys and girls
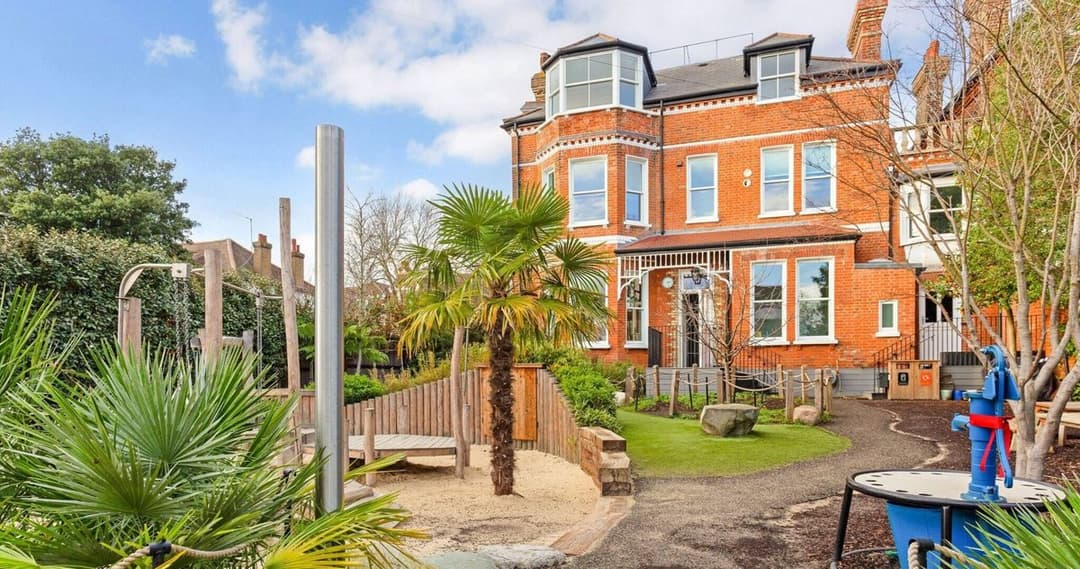
Ages 2 to 7 · boys and girls
Ages 4 to 11 · boys and girls
In the 2025 Year 6 tests, 46 of the 62 primary schools in London with published results had a bigger share of pupils reaching the expected standard in reading, writing and maths than the England average of 62%. Across London, 72% of Year 6 pupils reached it.
One dot per school; hover or tap a dot for its name.
| School | Value |
|---|---|
| The Cathedral School of St Saviour and St Mary Overie | 93% |
| Charles Dickens Primary School | 92% |
| St John's Roman Catholic Primary School | 92% |
| Angel Oak Academy | 90% |
| Harris Primary Academy East Dulwich | 89% |
| Redriff Primary, City of London Academy | 89% |
| Judith Kerr Primary School | 86% |
| Boutcher Church of England Primary School | 84% |
| Dulwich Hamlet Junior School | 84% |
| Saint Joseph's Catholic Primary School, the Borough | 83% |
| Brunswick Park Primary School | 82% |
| Phoenix Primary School | 80% |
| The Belham Primary School | 80% |
| Bessemer Grange Primary School | 78% |
| English Martyrs' Roman Catholic Primary School | 77% |
| Rotherhithe Primary School | 77% |
| Harris Primary Academy Peckham Park | 76% |
| Riverside Primary School | 76% |
| Southwark Park Primary School | 76% |
| Ark Globe Academy | 75% |
| St James the Great Roman Catholic Primary School | 75% |
| Victory Primary School | 74% |
| Alfred Salter Primary School | 73% |
| Ilderton Primary School | 73% |
| St John's and St Clement's Church of England Primary School | 73% |
| Oasis Academy Surrey Square | 72% |
| St Anthony's Catholic Primary School | 72% |
| Lyndhurst Primary School | 71% |
| Bellenden Primary School | 70% |
| Dulwich Wood Primary School | 70% |
| Heber Primary School | 70% |
| Albion Primary School | 69% |
| Galleywall Primary, City of London Academy | 69% |
| Friars Primary Foundation School | 68% |
| Ivydale Primary School | 68% |
| John Ruskin Primary School and Language Classes | 68% |
| St James' Church of England Primary School | 68% |
| St Peter's Church of England Primary School | 68% |
| Crawford Primary School | 67% |
| Grange Primary School | 67% |
| St Joseph's Catholic Junior School | 67% |
| St Joseph's Catholic Primary School | 67% |
| Pilgrims' Way Primary School | 66% |
| John Donne Primary School | 65% |
| Michael Faraday School | 65% |
| Keyworth Primary School | 63% |
| Crampton Primary | 62% |
| St George's Church of England Primary School | 62% |
| Snowsfields Primary School | 61% |
| St Paul's Church of England Primary School | 61% |
| Peter Hills with St Mary's and St Paul's CofE Primary School | 60% |
| St Francis RC Primary School | 60% |
| Goodrich Community Primary School | 59% |
| Hollydale Primary School | 59% |
| Tower Bridge Primary School | 59% |
| Grove Primary School | 56% |
| Goose Green Primary and Nursery School | 55% |
| Oliver Goldsmith Primary School | 51% |
| Rye Oak Primary School | 48% |
| John Keats Primary School | 47% |
| Robert Browning Primary School | 43% |
| St Jude's Church of England Primary School | 43% |
Highest share reaching the expected standard: The Cathedral School of St Saviour and St Mary Overie (93%), Charles Dickens Primary School (92%) and St John's Roman Catholic Primary School (92%).
At GCSE in 2026 (provisional figures), 15 of the 20 secondary schools in London with published results scored above the England average Attainment 8 of 46.2, an average of about grade 4.6 across eight subjects. The average across London's schools was 52.3.
One dot per school; hover or tap a dot for its name.
| School | Value |
|---|---|
| The Charter School North Dulwich | 62.5 |
| The St Thomas the Apostle College | 61.8 |
| St Michael's Catholic College | 58.7 |
| Sacred Heart Catholic School | 57.4 |
| Kingsdale Foundation School | 56.9 |
| The Charter School East Dulwich | 55.3 |
| Harris Academy Bermondsey | 54.2 |
| Harris Boys' Academy East Dulwich | 54.0 |
| Ark All Saints Academy | 52.1 |
| Bacon's College | 51.8 |
| Harris Girls' Academy East Dulwich | 51.3 |
| Haberdashers' Borough Academy | 49.2 |
| City of London Academy (Southwark) | 49.0 |
| St Saviour's and St Olave's Church of England School | 48.4 |
| Ark Globe Academy | 46.4 |
| Notre Dame Catholic Girls' School | 44.4 |
| Ark Walworth Academy | 44.0 |
| The Charter School Bermondsey | 43.9 |
| Harris Academy Peckham | 40.0 |
| South Bank University Academy | 32.6 |
Highest Attainment 8: The Charter School North Dulwich (62.5), The St Thomas the Apostle College (61.8) and St Michael's Catholic College (58.7).
Independent schools' GCSE results are not published in these tables, so the 5 independent secondary schools here are not included.
Source: Department for Education performance data. Schools with fewer than 11 pupils taking the tests are left out of the highest list, because a few pupils swing the figures.
For state schools you apply through your home council, which for families living in London is Southwark council, even if the school you want is in another council area. You list your preferences on one form, and the council makes one offer.
More: school admissions on GOV.UK.